Weather Effects and Fantasy Football, Part 1
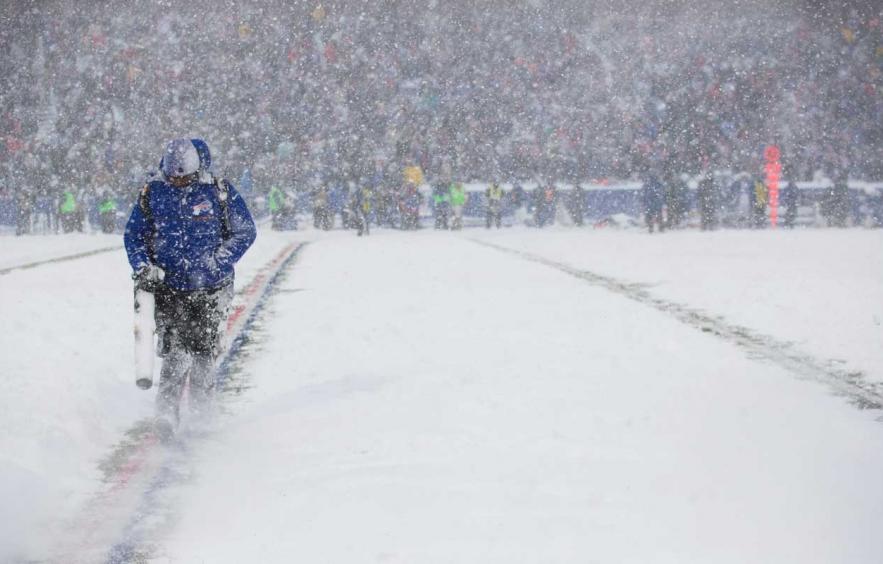
You’ve prepped all summer for the draft. Studied your league mates. Parsed average draft position (ADP) data until you know player value by memory. The draft comes and goes. Your roster is envied by all. You’re a favorite to win the league before the season starts! However, Week 1 hits you with the worst news:
“Scattered showers return this afternoon with gusty winds and heavy rain.”
Bad weather can pose as much of a problem to fantasy owners as injuries. Like the dreaded ‘Questionable’ tag, bad weather casts doubt on an otherwise positive matchup. We start to second-guess our quarterback and wide receivers. Our most trusted analysts give us the same talking points on their podcasts or weekly articles:
“Don’t get cute.”
“Start your studs.”
But, we remember. We remember the Week 14 snowstorm where 34-year-old Frank Gore had 37 touches which were the most in his career. Not in the season. His entire career. We remember seeing trash blowing over FedEx Field in Week 11 of the 2016 season before Kirk Cousins and Aaron Rodgers took the field. We remember the third week of the 2011 season where fans were treated to a torrential downpour. These games stick in our minds and play devil’s advocate when looking for reasons to sit a player. This is why the idea that football games are affected by bad weather is largely narrative driven. The data we largely recall supporting us is anecdotal.
Editor's Note: Click here for the second part of this series.
However, if the narrative has any basis then it can be supported by the data. The following series of articles will test various aspects of the game for any measurable differences under poor conditions. Starting with a high-level approach, the study will drill down to the team level with any tendencies or actionable info derived from the analysis. Each section will look at either a specific narrative or game level aspect that will guide the study.
Vegas Projections
Vegas projections, or betting lines, are a common starting point for all fantasy players. The original assumption was that if a team is forecasted to perform well, the associated production (e.g. yardage, touches, or touchdowns) could trickle down to the individual players. This has become more prevalent in the daily fantasy community but was shown to be more to the detriment of the fantasy owner. However, reviewing the projected totals and identifying games that will go over their total is important to a fantasy owner’s success.
Game totals are conservative as oddsmakers are considered risk adverse and understand projections are almost an industry on their own. So, the underlying assumption is that if poor weather conditions are forecasted then the projected totals would be less than the team totals. To test this, both the projections and actual totals from games played between 2003 and 2017 were collected along with their associated weather conditions for the following categories:
- Clear — baseline conditions; temperature range 60-75 °F; wind speed < 9 mph.
- Rain — temperature range > 45°F; condition descriptors: light rain, heavy rain, thunderstorm, or rain.
- Snow — condition descriptors: light snow, snow, blowing snow, or snow.
- Wind — temperature range > 45°F; wind speed > 13 mph.
Each game was categorized by its weather condition and the Delta (Projected Total minus Actual Total) was calculated. Each sample was averaged to observe any noticeable difference across the population. If the weather doesn’t have a measurable effect, the average Delta should be similar for each data set.

The Clear data set behaved as expected. Actual Totals are typically greater than Projected Totals thus generating a negative average Delta (-0.2536). However, that’s not the case for every other category. For each data set with games affected by weather, it was more likely the Actual Total was less than Vegas projections. The averages for Rain, Wind, and Snow are all influenced by game totals that fell short of their projections. This means that even with the conservative nature of the Vegas totals, there’s still a variable not being captured in the projections supporting the overall theory. With this, we can delve into the actual game data for more analysis.
FREE DOWNLOADABLE BONUS: Get a sneak peak at 16 of our data-driven, actionable articles: 20 Sleepers, Busts and Breakouts!
Air Yards
Shorter passes or a diminished deep game is a common narrative for bad weather games. The ball has a weaker grip or veering off its intended trajectory due to the wind are frequently heard reasons for this to occur. There is less passing and a greater emphasis on the run. To prove this, three decreasing trends would have to be observed in all weather conditions compared to the baseline:
- Average air yards per pass.
- Number of attempts.
- Percentage of deep passes.
Receiving yards give us the full story, but not its context. A 56-yard touchdown pass to Tyreek Hill could feature 13 air yards or 56, depending on if his he’s against the entire Dallas secondary. Air yards, from both completed and incomplete passes, give us a peek into what the coaches and quarterbacks are trying to do. All passes and their associated air yards from each game within the previous sample were averaged to observe the central tendency of each condition:

The differential between baseline conditions and the three weather categories is, at worst, a 2.0 percent decrease and, at best, a 5.3 percent increase. This deviates from the narrative. The types of passes being thrown, short or deep, are arguably similar for two of the three categories. But, each average could be skewed by the total number of attempts in each game. Total pass attempts were then viewed for context:

Rain and Wind have a small difference in attempts than ‘Clear’ conditions (less than 2.4%). This agrees with the air yards data in the previous figure. However, ‘Snow’ games have significantly fewer passes on average (8.3%). So while not all of the deviations are considered significant, games in these conditions do feature fewer pass attempts.
Finally, the deep game was observed. Deep passes are those greater than 15 air yards. If teams planned with the weather in mind, the number of deep passes with respect to the total volume would decrease.
|
Weather Condition |
Average Deep Passing Percentage |
|---|---|
|
Clear |
21.1 |
|
Rain |
21.0 |
|
Wind |
19.8 |
|
Snow |
20.8 |
The percentages appear similar, but couple the likelihood of fewer deep passes with a drop in attempts and the narrative gains analytical legs. Not surprisingly, ‘Wind’ exhibits the largest decrease in deep passing (6.2%). But even here, at a high level, the data does tilt in favor of weather having an effect on the games.
Target Distribution
If shorter passes dominate the offensive game plan, the underlying assumption is that running backs and tight ends become the beneficiaries. Targets to these positions are considered low risk to the quarterback. Also, the routes are closer to the line of scrimmage or towards the middle of the field, reducing the chance of a turnover. To support this assumption, games affected by weather should feature decreased target shares for wide receivers:
Wide receivers have a reduced market share for each weather condition at varying levels. Similar to the Air Yards analysis, ‘Rain’ and ‘Wind’ exhibit reduced effects while ‘Snow’ has the largest variance. Running backs, in particular, see the greatest jump in production with an average 7.7 percent increase in targets across all categories. Despite the small differences, the data warrants further investigation.
Takeaways
Football is a series of chaotic events that are comprised of multiple variables. Fantasy football analytics seeks to find variables that can be measured, tracked, and projected. To move past the narrative-based assumptions. Poor weather conditions won’t always mean reduced on-field production. However, the analysis conducted at the league level does support the narratives.
Weather is a variable we should consider in our game-day analysis.
The next part in the series will investigate the trends at the team level. Each NFL team is different from offensive scheme to personnel. Skill players and their archetype (e.g. slot receiver, pass-catching back) will be documented based on historical usage. Spikes in volume or performance can point towards players to target or avoid during these conditions.
Photo by Brett Carlsen/Getty Images.
Related Articles

