Week 14 DraftKings & FanDuel Winning GPP Lineup Review

In this space each week, I will review the winning lineups from the DraftKings Millionaire Maker and the FanDuel Sunday Million. Analyzing top lineups can help to tease out lineup-building strategies and offer clues on how you could have landed on a similar team.
DraftKings Week 14 Millionaire Winning Lineup

Ownership
| Week | QB | RB1 | RB2 | WR1 | WR2 | WR3 | TE | Flex | Flex Pos | DEF | Cumulative |
|---|---|---|---|---|---|---|---|---|---|---|---|
| 1 | 9.1% | 14.2% | 9.3% | 27.1% | 12.5% | 11.2% | 17.2% | 7.9% | WR | 3.0% | 111.5% |
| 2 | 3.6% | 10.4% | 8.4% | 21.3% | 19.7% | 14.4% | 9.2% | 6.3% | WR | 1.8% | 95.1% |
| 3 | 2.3% | 16.0% | 13.9% | 16.9% | 8.8% | 5.6% | 2.6% | 1.4% | WR | 15.7% | 83.2% |
| 4 | 6.8% | 38.0% | 15.2% | 15.4% | 11.4% | 5.7% | 19.8% | 6.1% | RB | 3.3% | 121.7% |
| 5 | 12.1% | 14.1% | 13.9% | 27.0% | 13.4% | 7.5% | 7.8% | 9.6% | RB | 22.7% | 128.1% |
| 6 | 4.4% | 12.7% | 8.5% | 14.7% | 4.9% | 3.2% | 2.6% | 2.4% | WR | 0.6% | 54.0% |
| 7 | 17.0% | 46.7% | 32.1% | 15.4% | 2.6% | 2.1% | 8.1% | 21.4% | RB | 43.8% | 189.2% |
| 8 | 21.1% | 50.9% | 12.5% | 27.6% | 28.8% | 26.4% | 1.6% | 7.4% | WR | 0.9% | 177.2% |
| 9 | 14.2% | 40.5% | 13.6% | 14.9% | 10.0% | 8.5% | 1.4% | 12.2% | RB | 10.2% | 125.5% |
| 10 | 29.4% | 25.8% | 10.6% | 20.4% | 16.9% | 10.3% | 16.0% | 2.4% | WR | 16.0% | 147.8% |
| 11 | 0.6% | 13.4% | 11.3% | 14.1% | 4.6% | 3.7% | 5.4% | 5.6% | RB | 6.6% | 65.3% |
| 12 | 7.0% | 10.4% | 3.5% | 14.8% | 13.1% | 8.8% | 17.4% | 4.5% | WR | 24.2% | 103.7% |
| 13 | 1.9% | 14.9% | 7.7% | 33.9% | 27.7% | 10.1% | 1.5% | 5.1% | WR | 4.0% | 106.8% |
| 14 | 2.5% | 21.3% | 7.4% | 27.1% | 11.3% | 6.0% | 3.6% | 2.0% | RB | 6.6% | 87.8% |
| AVG | 9.4% | 23.5% | 12.0% | 20.8% | 13.3% | 8.8% | 8.2% | 6.7% | 11.4% | 114.1% |
This lineup’s 87.8% cumulative ownership was the lowest since the beginning of 2019 for a winning Millionaire lineup with at least two players over 20%.
Stacks
| Week | Primary Stack | Secondary Stack | Third Stack | Correlated Players |
|---|---|---|---|---|
| 1 | QB/TE | RB/Opp WR | WR/Opp WR | 6 |
| 2 | QB/WR/WR/Opp TE | 4 | ||
| 3 | QB/TE | RB/Opp WR | 4 | |
| 4 | QB/WR/WR/Opp RB/Opp WR/Opp TE | 6 | ||
| 5 | QB/WR | RB/WR/TE | WR/Opp WR | 7 |
| 6 | QB/WR/Opp RB | 3 | ||
| 7 | QB/WR/TE | RB/Opp RB | 5 | |
| 8 | QB/WR/WR | RB/DEF | WR/TE | 7 |
| 9 | QB/WR/TE/Opp WR | RB/DEF | 6 | |
| 10 | QB/Opp WR | RB/Opp WR | TE/Opp WR | 6 |
| 11 | QB/WR/Opp RB | 3 | ||
| 12 | QB/RB | WR/Opp TE | WR/DEF | 6 |
| 13 | QB/WR | RB/TE | RB/WR | 6 |
| 14 | QB/WR/TE/Opp RB | WR/Opp RB | 6 |
The Week 14 Millionaire winner correlated two running backs with players from the opposite team. Since the beginning of 2020, only one other Milly winner has used two RB/Opposing Player correlations in the same lineup.
Flex
The edge this week was at wide receiver, with 58% of top-1% lineups using four wide receivers compared to just 51% of the field.
It was only the fourth time this season that top-1% lineups flexed tight end as often as the field, with 20% of lineups using two tight ends—on average, top-1% lineups flex tight end about 14% of the time compared to 18% of the field.
Leverage
Derick Henry was one of four running backs on at least 20% of rosters. His ownership was offset by a contrarian double stack on the other side that doubled as a salary pivot with a huge portion of the field playing Jared Goff over Trevor Lawrence at virtually the same salary. Evan Engram was also a salary-swivel with a 22% Greg Duclich priced just $100 more.
Miles Sanders had a salary that was within $100 of Ezekiel Elliott, who was in twice as many lineups.
Jerick McKinnon was priced identically to James Cook, who was in five times as many lineups while McKinnon’s teammate, Isaiah Pacheco was in four times as many lineups.
FanDuel Week 14 Sunday Million Winning Lineup

Ownership
| Week | QB | RB1 | RB2 | WR1 | WR2 | WR3 | TE | Flex | Flex Pos | DEF | Cumulative |
|---|---|---|---|---|---|---|---|---|---|---|---|
| 1 | 9.9% | 17.7% | 9.1% | 17.4% | 12.6% | 6.2% | 14.5% | 1.2% | RB | 2.8% | 91.4% |
| 2 | 3.0% | 7.9% | 2.8% | 9.9% | 6.4% | 5.9% | 8.7% | 0.5% | WR | 4.6% | 49.7% |
| 3 | 4.4% | 15.0% | 5.0% | 15.6% | 5.6% | 4.2% | 4.1% | 1.9% | RB | 6.6% | 62.4% |
| 4 | 2.2% | 31.2% | 12.8% | 11.7% | 7.6% | 7.6% | 20.1% | 3.9% | RB | 4.8% | 101.9% |
| 5 | 17.8% | 17.4% | 13.0% | 22.7% | 14.7% | 0.9% | 3.8% | 6.3% | RB | 4.6% | 101.2% |
| 6 | 4.2% | 29.8% | 2.9% | 13.7% | 4.3% | 4.0% | 0.4% | 0.7% | WR | 8.0% | 68.0% |
| 7 | 16.2% | 25.1% | 22.6% | 17.5% | 5.4% | 4.0% | 11.3% | 16.0% | RB | 2.9% | 121.0% |
| 8 | 22.7% | 61.6% | 14.9% | 25.7% | 23.0% | 10.3% | 7.7% | 14.3% | RB | 17.0% | 197.2% |
| 9 | 7.2% | 31.1% | 8.8% | 16.0% | 12.1% | 4.3% | 1.1% | 6.4% | RB | 11.6% | 98.6% |
| 10 | 21.6% | 26.0% | 10.5% | 24.4% | 17.1% | 6.3% | 13.7% | 5.2% | RB | 12.4% | 137.2% |
| 11 | 24.2% | 15.9% | 4.6% | 19.6% | 4.7% | 3.7% | 7.8% | 1.6% | RB | 10.9% | 93.0% |
| 12 | 11.7% | 15.9% | 12.2% | 12.9% | 8.9% | 4.3% | 14.6% | 2.2% | RB | 12.8% | 95.5% |
| 13 | 8.8% | 15.5% | 3.5% | 24.4% | 15.6% | 15.1% | 8.5% | 0.1% | WR | 4.6% | 96.1% |
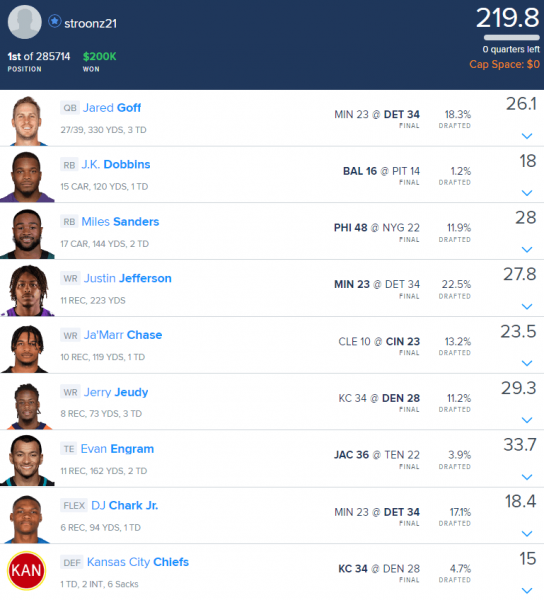
| 14 | 18.3% | 11.9% | 1.2% | 22.5% | 17.1% | 13.2% | 3.9% | 11.2% | WR | 4.7% | 104.0% |
| AVG | 12.3% | 23.0% | 8.9% | 18.1% | 11.1% | 6.4% | 8.6% | 5.1% | 7.7% | 101.2% |
Week 14’s Sunday Million winner didn’t roster a running back with at least 15% ownership, only the second winner this year to be that contrarian at running back.
Stacks
| Week | Primary Stack | Secondary Stack | Third Stack | Correlated Players |
|---|---|---|---|---|
| 1 | QB/TE | 2 | ||
| 2 | QB/WR/WR/Opp TE | RB/Opp WR | 6 | |
| 3 | QB/TE | RB/WR/DEF | RB/WR | 7 |
| 4 | QB/RB/WR/TE/Opp WR | RB/WR | 7 | |
| 5 | QB/WR/WR | RB/TE | 5 | |
| 6 | QB/WR | WR/TE | 4 | |
| 7 | QB/WR/WR | 3 | ||
| 8 | RB/WR | WR/Opp WR/Opp TE | 5 | |
| 9 | QB/WR/TE | RB/WR | 5 | |
| 10 | QB/TE | RB/WR | 4 | |
| 11 | RB/WR/Opp RB | WR/Opp TE | 5 | |
| 12 | QB/RB/TE | WR/WR | 5 | |
| 13 | QB/WR | RB/DEF | WR/TE | 6 |
| 14 | QB/WR/Opp WR | 3 |
This was just the third Sunday Million winner in 2022 to use a bring-back with their main quarterback stack—from 2019–2020, 50% of quarterback stacks in winning Sunday Million lineups used a bring-back.
Only two other winners this year used just a primary quarterback stack and no other mini-correlations.
Flex
Since the beginning of 2019, 24 of 66 Sunday Million winners have flexed a WR but this week was just the second time in that span that a winner had four WRs all with ownership above 10%
Remember to flex your latest player possible, which this lineup got away with ignoring.
Leverage
Roster construction added a unique element to this lineup—only two other winners since Week 1 of 2019 have spent more than $8,500 on two wide receivers as this lineup did. Using a skill player against the opposing defense seems counterproductive but a defensive score can create an amplified game environment.
Playing his first game since Week 6, J.K. Dobbins was the most unique piece of this lineup. Dobbins was priced near Latavius Murray and Travis Homer, who both varied double-digit ownership/


