Divisional Round Single-Game NFL DFS: Buccaneers and Lions Top FanDuel & DraftKings Plays

Welcome to the showdown breakdown for the NFC Divisional Round game between the Tampa Bay Buccaneers and the Detroit Lions. The NFC South champion Buccaneers, coming off a commanding 32-9 victory over the Eagles in the divisional round, now head to Detroit to face the NFC's number three seed Lions for a game that, at least on paper, has some serious shootout potential. Let’s take a look at the key strategies and top plays in this battle of cast-off former number-one overall picks.
Game Environment
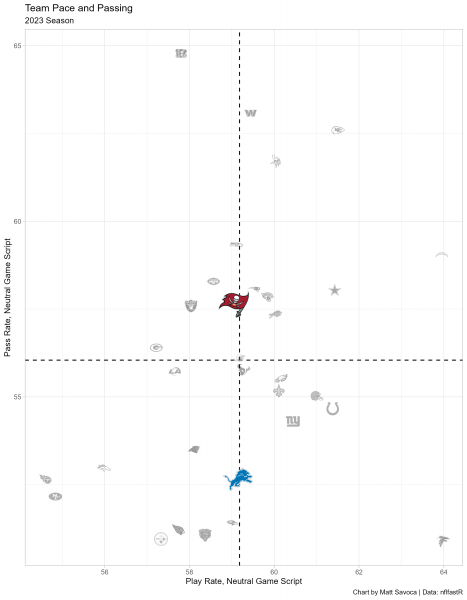
This chart represents the general offensive strategies for each team when the game outcome is still in question (win probability between 20% and 80%). The final two minutes of each half are also excluded. We’ll include last year’s statistics through Week 4 of the regular season. Teams in the upper-right quadrant pass more often and play faster than the average NFL team in neutral game scripts, and conversely, teams in the lower-left quadrant play slower and run more often than the average NFL team.
Buccaneers (21) @ Lions (27.5); Over/Under 48.5
Tampa Bay’s approach is slightly more pass-oriented than league average in neutral game scripts, but they still tend to play at an average pace. Baker Mayfield averages 4.6 deep pass attempts per game, slightly above average, but his red zone aggression dips to just 3.8 passes inside the 20-yard line per game. This has led to the team ranking 19th overall in pass plays per game. They have no problem leaning on Rachaad White and the rushing game when leading, however, the expected game environment against the Lions likely necessitates a more aggressive, pass-first strategy throughout, especially against a Detroit secondary that ranks bottom-10 in pass-defense DVOA. The Buccaneers have scored 3.0 touchdowns per game over their last three games, seventh-best in the NFL.
The Lions edged out a close 24-23 win against the Rams in the Wild Card round, showcasing their typical run-heavy approach by having Goff attempt just 27 pass attempts—though to be fair, Goff averaged 10 yards per attempt for the second game in a row. That hyper-efficiency can often lead to a decrease in total attempts. Still, we’ve seen the Lions flip on a dime to a pass-heavy scheme when the matchup calls for it, and it very well could against Tampa Bay’s middling secondary that ranks 15th in pass defense DVOA.
Jared Goff and company ultimately averaged the ninth-most pass plays per game, despite having the seventh-best average score differential in the league. Goff's deep passing attack has never been a huge part of his game, and he averaged a well below-average 2.9 passes of 20-plus air yards per game. However, OC Ben Johnson increased his passing in the red zone, where the team averages 4.9 attempts per game. This strategy has worked stupendously well, with the Lions averaging the third-most offensive touchdowns per game this season and climbing to second when looking at their last three games.
Quarterback Analysis
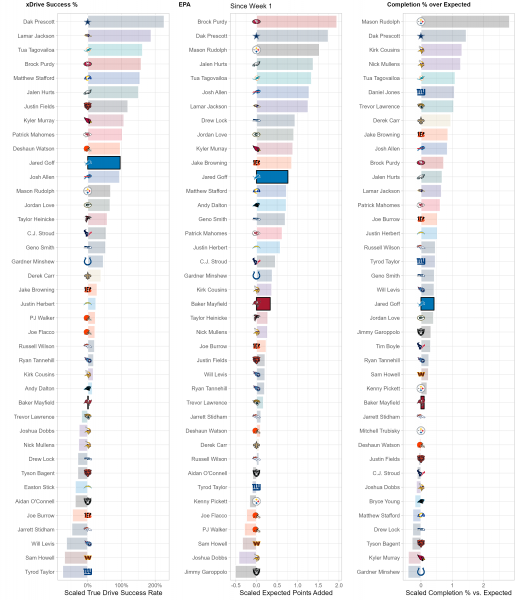
While there may be 22 people on the field for every play, each play and game is heavily dictated by the performance of each team’s quarterback. While efficiency isn’t everything for quarterbacks, it is the best indicator of future performance, so we use a trio of metrics to suss out top performers at the position compared to lackluster ones. xDrive Success %, or True Drive Success Rate, is a measurement of a QB’s ability to turn drives into scores weighted by sample size. EPA or Expected Points Added, is a measurement of the QB’s contribution, both running and throwing, to the team’s scoring and production vs. the average NFL team. Completion % over Expected (CPOE)represents the accuracy and efficiency of a QB’s passes compared to league expectations.
Baker Mayfield's metrics are all over the place. He ranks just below the league average in CPOE and in true drive success rate, but in EPA per game, he ranks well above average. He ranks between 10th and 20th in the NFL in Adjusted Yards per Attempt (AYA), Quarterback Rating (QBR), true passer rating, expected fantasy points per game, and fantasy points per game. Yet somehow PlayerProfiler ranks Mayfield best in the NFL in their key Production Premium efficiency metric. For one thing, we know Mayfield isn’t afraid to take deep shots, as his average depth of target (ADOT) of 8.6 yards was the fifth-highest in the NFL. Despite a lack of significant rushing upside, Mayfield managed to average 16.7 fantasy points per game, 17th among quarterbacks.
Jared Goff enjoyed one of his most productive seasons as a pro this season for the Lions. He ranked top 15 in true drive success rate and EPA per game, and top 10 in true passer rating, AYA, and passing touchdowns per game. Goff, however, has been vulnerable under a collapsing pocket. He ranks fourth-best in accuracy rating from a clean pocket (according to PlayerProfiler) but falls outside the top 25 when pressured. He threw the sixth-most passes under pressure this season. That led to 20 passes charted as interceptable, 11th-most in the NFL. Despite that, and without any rushing ability to speak of, Goff averaged 17.8 fantasy points per game during the regular season, just inside the top-12 quarterbacks this season.
Core Plays and Auxiliary Options

- DFS & Season-Long Content
- Lineup Generator
- Optimal Cash & GPP Lineups
- Floor & Ceiling Projections
- -Leverage Scores
- -...and much much more!

