Week 6 Thursday Night Football Single-Game NFL DFS: Top FanDuel & DraftKings Plays

Welcome to the showdown breakdown for Week 6 Thursday Night Football, featuring a divisional battle between the Denver Broncos and the Kansas City Chiefs. The Broncos come into the game at 1-4, trying to shake off a bad loss to the Jets, and are facing AFC irrelevancy with a slide to 1-5. They're facing a Chiefs team that is 4-1 and looks to continue its dominance since an opening-night hiccup against the Lions. We’ve got decent clarity when it comes to injuries tonight, as reports have confirmed TE Travis Kelce is playing and Denver RB Javonte Williams is also active and part of a now-crowded Broncos backfield. The Chiefs enter the game as massive favorites. With Denver's defense ranking among the league's worst, it could be a long night for Denver fans. Let's delve into the data and strategies for this single-game DFS slate.
For up-to-the-minute updates leading up to kickoff, be sure to join the 4for4 DFS subscriber-only Discord channel.
Game Environment
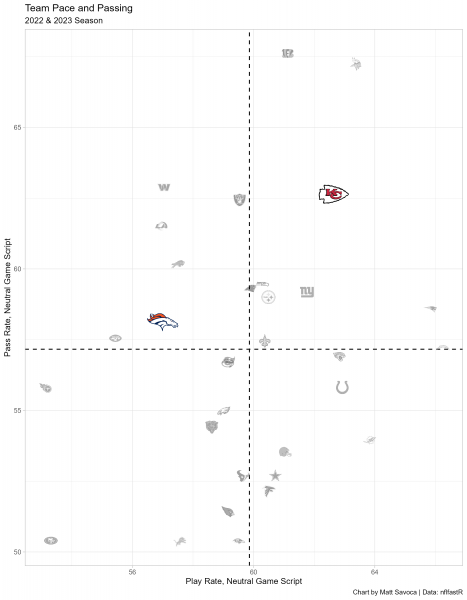
This chart represents the general offensive strategies for each team when the game outcome is still in question (win probability between 20% and 80%). The final two minutes of each half are also excluded. Teams in the upper-right quadrant pass more often and play faster than the average NFL team in neutral game scripts, and conversely, teams in the lower-left quadrant play slower and run more often than the average NFL team.
Broncos (+10.5, 18.25) @ Chiefs (-10.5, 29.75); Over/Under: 48
The Broncos are 10.5-point underdogs, with an implied total of just 18.5, going up against the Chiefs who are expected to score just under 30 points. The over/under is set at 48, indicating a fairly high-scoring affair. Denver's game script will likely have to adjust to Kansas City's fast-paced, pass-heavy offense. The Chiefs average 37.8 pass attempts per game, sixth most in the NFL, and they have been playing in positive game scripts with an average score differential per play of 6.6 points.
On the other side, Denver's offense, led by Russell Wilson, has been struggling, but seems averse to using increased pace to keep themselves in games. The Broncos rank 20th in seconds per play and have an average score differential per play of -7.0 points, third worst in the league. At the very least, they pass more than league average in neutral games crips, and throw a ton in the red zone, adding to the shootout potential.
Quarterback Analysis
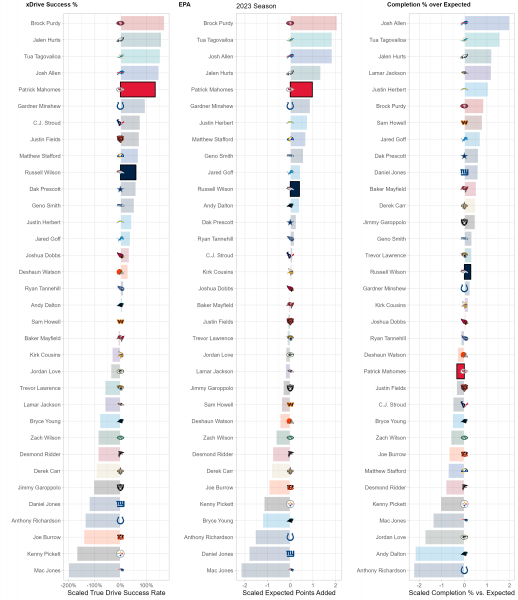
While there may be 22 people on the field for every play, each play and game is heavily dictated by the performance of each team’s quarterback. While efficiency isn’t everything for quarterbacks, it is the best indicator of future performance, so we use a trio of metrics to suss out top performers at the position compared to lackluster ones. xDrive Success %, or True Drive Success Rate, is a measurement of a QB’s ability to turn drives into scores weighted by sample size. EPA or Expected Points Added, is a measurement of the QB’s contribution, both running and throwing, to the team’s scoring and production vs. the average NFL team. Completion % over Expected (CPOE)represents the accuracy and efficiency of a QB’s passes compared to league expectations.
Veteran quarterback Russell Wilson has been the subject of much scrutiny due to the Broncos' horrible start. Despite the team's woes, Wilson's metrics paint a picture of a solidly above-average quarterback. He ranks above the NFL average in EPA per game and true drive success rate. He’s top 10 in yards per attempt, true passer rating, and red zone completion percentage. He has exceeded 15 DraftKings points in every game this season and has topped 25 points once. Sure, his rushing ability seems all but gone at this point in his career, as he averages only 3.6 carries per game, ranking 15th among quarterbacks, but the fantasy outlook for Wilson is still better than the team’s.
On the flip side, Patrick Mahomes is, almost hilariously, having what some might consider a "down year," but that’s more a testament to his previous astronomical standards than a criticism of his overall play. Ranking fifth in EPA per game and xDrive Success rate, Mahomes continues to be elite in almost every feasible metric. While his completion percentage against expectation looks like a concern, deeper metrics reveal there's not much to worry about at all. His 82% catchable pass rate is second-best in the league, and he's equally efficient against both man and zone coverage, ranking top five in accuracy against both defensive schemes. The Chiefs' receivers lead the league in average separation but also, unfortunately, in dropped passes. This suggests that the Chiefs' offense has yet to reach its full potential, making Mahomes the same, ever-dangerous DFS option he always is.
Core Plays and Auxiliary Options

- DFS & Season-Long Content
- Lineup Generator
- Optimal Cash & GPP Lineups
- Floor & Ceiling Projections
- -Leverage Scores
- -...and much much more!


