NFL DFS Playbook: Running Back Strategy Guide

In the first article of the DFS Playbook, I outlined how to best predict and project quarterback fantasy scoring, laying out which stats are most relevant to the position and how past performance correlates to future outcomes.
This section will focus on the running back position to help DFS players research the position for the most likely outcomes in cash games as well as how to approach the position in tournaments relative to salary and ownership.
DFS Playbook 2021: QB | WR | TE | DEF
How to Predict Fantasy Scoring for Running Backs
Use Relevant Sample Sizes
Every week, analysts across the fantasy landscape will reference a player’s recent performance as a reason to play or fade said player—sometimes that time frame is one game, sometimes it’s the entire season, but it’s often not clear why a time span is chosen other than that it fits the point that is trying to be made. To make matters worse, a distinction is rarely made between positions on how far back we should look to determine a relevant sample of games. As we saw with quarterbacks, a larger sample of games isn’t necessarily more predictive.
For running backs, we looked to the stat that we care about the most—fantasy points—for every game over the last three seasons and the relationship between a running back’s performance in one game to his per-game average for every possible sample size (1 game to 15 games).
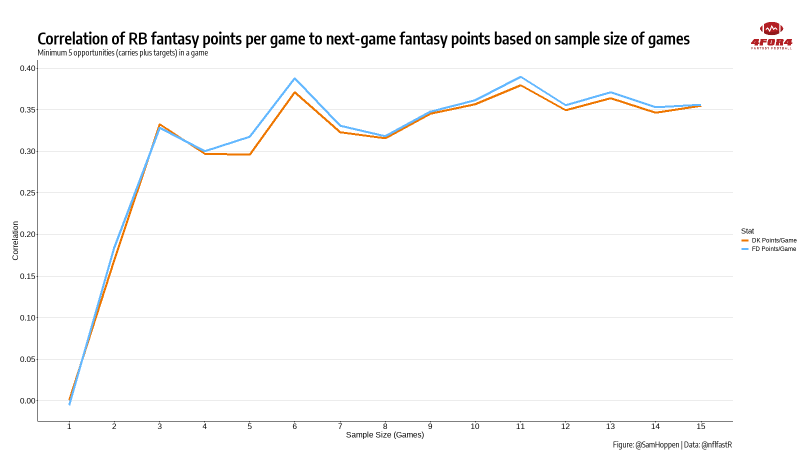
When referencing fantasy points scored, the most relevant sample size for predicting next-game performance for running backs is six games. While there is a slight decrease in correlation of running back fantasy points per game to next-game fantasy points as the sample gets beyond six games, note that each sample size beyond six games still has a correlation around 0.35. This is important, as it shows that running back performance is more stable than any other position once the sample size reaches six games. For example, recall that for quarterbacks the optimal sample size was five games but even a five-game sample had a correlation to next-game scoring of just under 0.20.
All other things being equal, when referencing running back fantasy points in terms of potential in-season future production, use at least a six-game sample when possible—samples of fewer than three games are likely just noise.
Which Running Back Stacks are the Most Predictable
It’s often said that volume is king in fantasy football and that statement is especially true at running back. Consider how next-game fantasy points on both FanDuel and DraftKings correlates to various running back stats using a three-game historical average (1) of those stats.
| Stat | Correlation to DK Points | Correlation to FD Points |
|---|---|---|
| Total Yards | 0.38 | 0.37 |
| Opportunities (Rush Attempts+Targets) | 0.37 | 0.37 |
| Rushing Yards | 0.31 | 0.31 |
| Rush Attempts | 0.30 | 0.31 |
| Targets | 0.25 | 0.21 |
| Receiving Yards | 0.24 | 0.21 |
| Receptions | 0.24 | 0.20 |
| Yards/Rush Attempt | 0.11 | 0.11 |
| Yards/Touch | 0.11 | 0.09 |
| Touchdown Rate (Touchdowns/Touches) | 0.08 | 0.08 |
Table: @SamHoppen| Data: @nflfastR
Since yards are a direct function of touches, it makes sense that yardage totals correlate nearly as strongly to fantasy scoring as opportunities but the takeaway is that opportunities (targets plus carries) should be the foundation for our running back research. Furthermore, it’s intuitive that receiving metrics carry more weight on DraftKings than on FanDuel due to DK’s full-PPR scoring system.
Another angle when looking at this correlation data is that fantasy players should be wary about targeting running backs coming off of big performances if those performances were simply a product of a couple of big plays or rare goal-line opportunities. Efficiency metrics such as touchdown rate or yards per touch carry virtually no weight when predicting a running back’s future fantasy performance.
Using Betting Lines for Running Back Projections
It’s no secret that we want running backs on teams that win—of the 74 instances of a running back scoring at least 25 DraftKings points last season, nearly 70% of those games came from a running back on the winning team.
This might lead one to believe that they should only use running backs in DFS when that running back’s team is favored and even use point spreads as a justification to lock in a certain player pool—this line of thinking is somewhat flawed. Consider how running back fantasy points correlate with various betting odds:
| Betting Odds | Correlation to DK Points | Correlation to FD Points |
|---|---|---|
| Implied Team Total | 0.21 | 0.22 |
| Over/Under | 0.18 | 0.19 |
| Spread | -0.13 | -0.13 |
Table: @SamHoppen| Data: @nflfastR
At first glance, this data seems to suggest that point spreads have almost no predictive power in terms of running back production but the data considers all usable running backs—specialty backs such as pass-catchers and short-yardage/goal-line backs and running back committees are all impacted differently by different game flows.
To get a better idea of where running back scoring comes from in relation to the point spreads and home/road splits, I looked at different point thresholds for each of those situations.
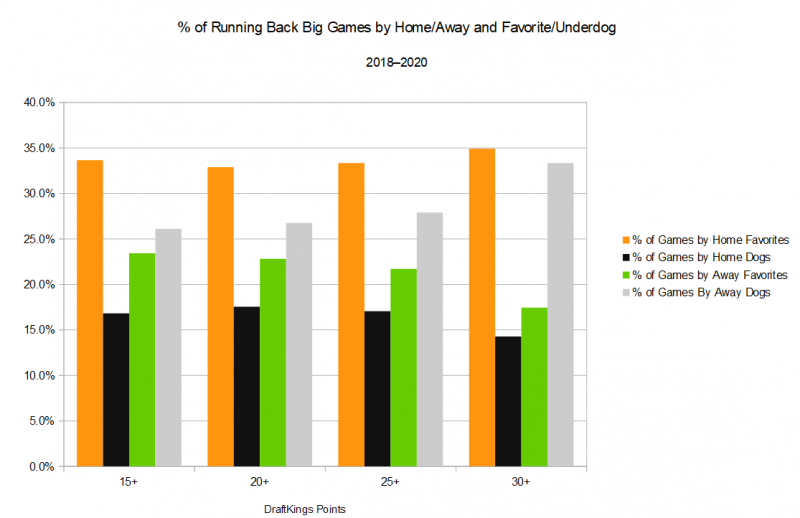
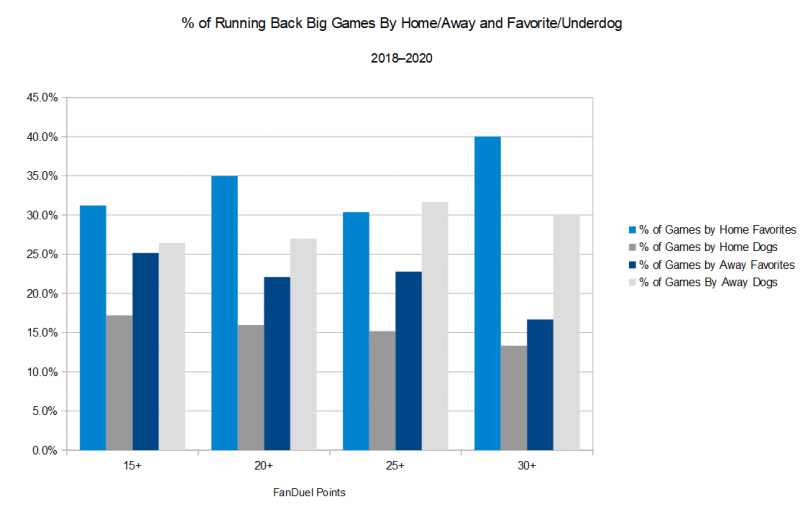
No matter the arbitrary point threshold used, nearly 60% of big games came from favorites, and the most likely running back to hit each threshold were home favorites—for example, the image above shows that 40% of running backs who scored 30 or more FanDuel points were on a home favorite. What’s surprising is that road underdogs hit each threshold more often than home dogs ad even road favorites. The reason: volume.
Take, for example, all backs that hit 20 DK points in 2020—two-thirds of those players saw at least 65% of their team’s backfield touches. If we look at players that scored at least 25 DK points, nearly 80% of those backs handled over two-thirds of the backfield load.
While point spreads can tell us which teams are most likely to win, betting lines are far from perfect and we should seek out workhorses first, then look for the ideal home favorite. With that said, a running back that sees the vast majority of the team’s backfield work usually offers more upside even as an underdog than a committee back on a favorite.
In tournaments, there might even be added value in targeting bell-cow backs that are likely to carry low ownership because they are underdogs on visiting teams.
As was the case with quarterbacks, the best way to encompass all of this information is through 4for4 projections. In fact, no position has been more predictable than running back with 4for4 projections carrying a 0.65 correlation to fantasy points over the last two seasons.
Salary-Based Point Expectation
Just as running back has been the easiest position to project, it has also been the position with the sharpest salaries on both FanDuel and DraftKings—over the last two seasons, salary has had a roughly 0.60 correlation to fantasy points on both sites.
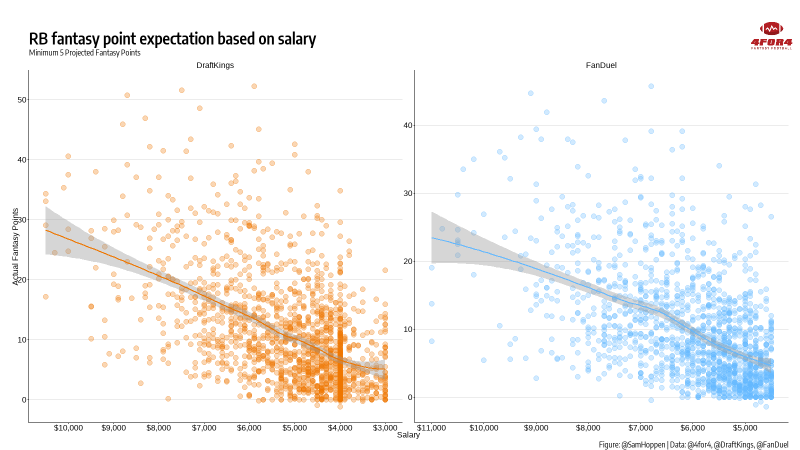
The sharp downward angle of the trend line above tells us that cheaper backs simply do not score as much, as consistently as their high-priced counterparts. Of course, there will be some pricing inefficiencies when it comes to ambiguous backfields or surprise injuries but it’s generally common knowledge which backs get the most work and their salaries reflect that.
Whether in cash games or GPPs, high-touch running backs carry so much value that it’s almost always worth it to pay for one and sometimes two. In cash games, the flex position should almost always be a running back with a lean towards pass-catchers on DraftKings and more value on game script and scoring upside on FanDuel.
Building an expected points model such as the one here allows 4for4 to project value in a non-linear fashion and use our fantasy point projections to model the likelihood of running backs hitting cash or GPP expectations.
With these models, cash game players can consider all of the factors outlined in the previous section and ultimately compare running backs to other positions without faulty metrics such as simple points per dollar.
How to Pick Running Backs in DFS GPPs
It should be fairly evident that in order to win tournaments a DFS lineup has to be at least somewhat unique but that doesn’t mean being contrarian at every roster spot. Even in the largest weekly contests, winners often only have a few players that carry single-digit ownership.
Using data from the DraftKings Millionaire and the FanDuel Sunday Million over the last two seasons, we can see how the best lineups approached the running back position in terms of both ownership percentages and salary.
Running Back Ownership Percentages
If running backs are the easiest position to project in terms of volume and fantasy scoring, it makes sense that it rarely pays to be contrarian at the position. Since the beginning of 2019, no roster spot has carried a higher ownership percentage on winning Millionaire and Sunday Million lineups than a team’s RB1 (2). On both sites, only the WR1s possessed a higher average ownership than winning lineups’ RB2s.
Just three Millionaire winners over the past two seasons didn’t roster a running back with at least 10% ownership and there were no such Sunday Million winners. Conversely, two-thirds of Milly winners used at least one running back with ownership above 20% and over 70% of Sunday Million winners did so.
Winners used a variety of ownership strategies for their second running back with ownership as high as 27% and as low as 2.4% for the RB2 in winning millionaire lineups. Big winners on FanDuel were less likely to be contrarian at either running back spot with over a quarter of Sunday Million winning lineups using two backs with ownership above 20%.
| Week | RB1 DraftKings 2019 | RB1 DraftKings 2020 | RB2 DraftKings 2019 | RB2 DraftKings 2020 | RB1 FanDuel 2019 | RB1 FanDuel 2020 | RB2 FanDuel 2019 | RB2 FanDuel 2020 |
|---|---|---|---|---|---|---|---|---|
| 1 | 37.0 | 25.4 | 26.7 | 8.4 | 28.1 | 36.7 | 25.0 | 22.4 |
| 2 | 14.7 | 9.2 | 8.5 | 8.9 | 23.0 | 35.5 | 13.9 | 26.8 |
| 3 | 22.2 | 11.7 | 10.2 | 2.4 | 24.4 | 37.2 | 11.4 | 23.6 |
| 4 | 7.2 | 19.0 | 3.4 | 16.7 | 12.7 | 25.2 | 11.1 | 16.2 |
| 5 | 24.7 | 13.3 | 12.1 | 4.4 | 43.5 | 34.7 | 6.4 | 0.8 |
| 6 | 25.6 | 26.1 | 9.5 | 9.2 | 19.5 | 31.4 | 9.2 | 19.3 |
| 7 | 27.8 | 36.9 | 25.9 | 10.2 | 34.7 | 15.7 | 15.6 | 5.2 |
| 8 | 34.8 | 27.7 | 4.0 | 10.4 | 35.8 | 19.0 | 29.2 | 8.7 |
| 9 | 50.7 | 38.6 | 24.5 | 6.3 | 31.2 | 43.0 | 4.8 | 6.2 |
| 10 | 16.9 | 13.5 | 8.5 | 4.5 | 16.2 | 16.5 | 14.2 | 6.8 |
| 11 | 23.4 | 42.5 | 12.3 | 8.5 | 26.6 | 14.6 | 9.4 | 13.9 |
| 12 | 30.6 | 29.0 | 14.8 | 12.3 | 19.9 | 20.2 | 17.7 | 10.9 |
| 13 | 30.2 | 13.0 | 16.1 | 11.3 | 42.8 | 25.9 | 39.4 | 9.8 |
| 14 | 16.0 | 26.4 | 11.4 | 22.9 | 15.3 | 35.2 | 12.3 | 26.2 |
| 15 | 33.8 | 7.1 | 25.4 | 5.6 | 46.5 | 33.5 | 5.3 | 14.4 |
| 16 | - | 43.7 | - | 14.0 | 23.7 | 24.0 | 22.7 | 14.3 |
| 17 | 32.3 | 25.1 | 18.9 | 10.8 | 14.8 | 40.6 | 12.6 | 26.5 |
| Average | 26.7 | 24.0 | 14.5 | 9.8 | 27.0 | 28.8 | 15.3 | 14.8 |
How Much GPP Winners Spend on Running Backs
DFS players typically understand how predictable running back scoring is and the community has had no problem paying up at the position, making running back the roster slot with the highest salary allocation to go along with the highest ownership. Over the past two seasons, Millionaire winning lineups have spent nearly 16% of their salary on their RB1, on average, with over a quarter of their salary going to the two required running back spots combined.
Sunday Million winners have regularly spent about 14% of their salary on their most expensive running back with 25% of their $60,000 allowance going to the two required roster spots for running backs.
When compared to other positions, the RB1 runs away with the highest salary allocation among winners, while the RB2 has typically cost less than a team’s quarterback and most expensive wide receiver. There’s no one-size-fits-all solution to how much to spend at each position, but it’s rare that a running back with a salary near the minimum has enough upside to be used in one of the required roster slots in large-field tournaments.
The table below shows the range of salary spent on the position in winning lineups.
| Week | RB1 DraftKings 2019 | RB1 DraftKings 2020 | RB2 DraftKings 2019 | RB2 DraftKings 2020 | RB1 FanDuel 2019 | RB1 FanDuel 2020 | RB2 FanDuel 2019 | RB2 FanDuel 2020 |
|---|---|---|---|---|---|---|---|---|
| 1 | $8,800 | $6,800 | $6,000 | $5,800 | $8,900 | $10,000 | $7,900 | $8,200 |
| 2 | $8,700 | $7,100 | $6,000 | $6,000 | $8,500 | $8,600 | $7,900 | $7,700 |
| 3 | $8,700 | $7,800 | $4,300 | $4,000 | $8,900 | $8,200 | $7,100 | $7,500 |
| 4 | $6,800 | $5,800 | $6,400 | $5,700 | $7,300 | $8,700 | $6,800 | $6,800 |
| 5 | $8,700 | $5,700 | $5,900 | $4,600 | $6,800 | $6,800 | $6,800 | $5,900 |
| 6 | $8,500 | $7,300 | $6,000 | $6,000 | $8,500 | $9,000 | $6,900 | $5,900 |
| 7 | $8,000 | $6,000 | $5,100 | $4,000 | $8,300 | $6,400 | $7,600 | $4,800 |
| 8 | $5,800 | $8,000 | $5,000 | $7,500 | $7,700 | $9,200 | $6,200 | $5,900 |
| 9 | $10,000 | $8,500 | $4,000 | $8,200 | $9,700 | $9,500 | $6,300 | $9,300 |
| 10 | $6,400 | $8,200 | $4,300 | $6,500 | $7,600 | $9,000 | $7,000 | $7,500 |
| 11 | $10,500 | $9,000 | $6,000 | $4,800 | $8,400 | $8,200 | $7,800 | $6,500 |
| 12 | $8,100 | $7,900 | $6,900 | $6,300 | $8,400 | $8,400 | $7,000 | $7,400 |
| 13 | $7,400 | $7,300 | $5,400 | $6,300 | $11,000 | $8,400 | $5,800 | $6,200 |
| 14 | $6,700 | $8,700 | $6,300 | $6,500 | $7,800 | $9,600 | $7,300 | $7,000 |
| 15 | $7,700 | $7,000 | $7,500 | $6,400 | $8,500 | $10,200 | $7,400 | $5,100 |
| 16 | - | $7,700 | - | $6,100 | $8,800 | $7,000 | $6,200 | $6,700 |
| 17 | $8,100 | $7,400 | $8,000 | $6,100 | $8,800 | $10,200 | $7,300 | $6,300 |
| Average | $8,056 | $7,424 | $5,819 | $5,929 | $8,465 | $8,671 | $7,018 | $6,747 |
Deciding Who to Use in the Flex in GPPs
Trends have shifted heavily in recent years when it comes to what has worked in the flex position (3) in DraftKings tournaments. In 2019, 11 of 17 Millionaire winners flexed a running back—last season that number plummeted to just four. Going back to 2018, running back and wide receiver were split about 50/50 in winning Milly lineups, which is likely closer to the optimal strategy. When DK winners have flexed a running back the average salary has been about $4,500 with average ownership near 8%. There have only been four Millionaire winners over the past two seasons to use three running backs with a salary of at least $5,000 or three backs with ownership above 10%.
FanDuel’s half-PPR scoring is more running back friendly. Over 60% of Sunday Million winners have used a running back in the flex over the past two seasons. That doesn’t make running back a lock in the flex in FanDuel tournaments but it is the preferred strategy when you consider that a tight end occasionally makes it into the winning lineup. Running backs in the flex have averaged a salary around $6,000 in winning Sunday Million lineups with ownership between 7% and 8%. Although the averages show a contrarian strategy for running backs used in the flex, a fair number of winners on FanDuel have used three somewhat chalky running backs—seven winners over the last two seasons rostered three running backs with ownership above 10%.
| Season | Week | Ownership | Salary |
|---|---|---|---|
| 2019 | 1 | 20.3 | $4,000 |
| 2019 | 3 | 2.9 | $4,700 |
| 2019 | 5 | 12.0 | $4,500 |
| 2019 | 6 | 7.0 | $4,600 |
| 2019 | 7 | 9.7 | $5,700 |
| 2019 | 10 | 6.3 | $3,900 |
| 2019 | 12 | 12.7 | $5,000 |
| 2019 | 13 | 8.8 | $4,400 |
| 2019 | 14 | 4.5 | $5,000 |
| 2019 | 15 | 5.2 | $3,000 |
| 2019 | 17 | 13.9 | $4,200 |
| 2020 | 3 | 1.9 | $4,800 |
| 2020 | 4 | 3.8 | $5,500 |
| 2020 | 6 | 4.1 | $5,000 |
| 2020 | 12 | 7.0 | $4,700 |
| Average | 8.0 | $4,600 |
| Season | Week | Ownership | Salary |
|---|---|---|---|
| 2019 | 1 | 19.1 | $7,400 |
| 2019 | 2 | 8.9 | $6,500 |
| 2019 | 3 | 6.5 | $7,000 |
| 2019 | 4 | 3.5 | $6,400 |
| 2019 | 6 | 6.9 | $5,300 |
| 2019 | 7 | 5.4 | $6,500 |
| 2019 | 8 | 3.7 | $6,200 |
| 2019 | 10 | 11.4 | $6,000 |
| 2019 | 13 | 1.1 | $5,400 |
| 2019 | 15 | 5.3 | $6,200 |
| 2019 | 16 | 12.9 | $5,600 |
| 2019 | 17 | 7.7 | $6,400 |
| 2020 | 2 | 12.2 | $4,000 |
| 2020 | 3 | 14.7 | $5,800 |
| 2020 | 4 | 3.5 | $6,700 |
| 2020 | 6 | 10.8 | $6,300 |
| 2020 | 8 | 1.4 | $5,800 |
| 2020 | 10 | 6.6 | $4,600 |
| 2020 | 12 | 1.4 | $6,000 |
| 2020 | 14 | 9.8 | $5,000 |
| 2020 | 15 | 1.0 | $6,600 |
| 2020 | 17 | 10.1 | $4,700 |
| Average | 7.5 | $5,927 |
Whether or not to use a running back in the flex in GPPs is dependant on the specific week and roster considerations such as how much salary to spend at other positions and how team stacks are built.
The big takeaway here is that if there are cheap, contrarian running backs in your GPP player pool, they are usually best used as your third running back, not one of your primary running back options.
The Bottom Line
- When using running back fantasy scoring to predict the next game, the optimal sample size is six games but the correlations are strong enough beyond six games that there is no downside to using larger sample sizes within a single season.
- Running back performance is more stable than any other position once the sample size reaches six games—samples of fewer than three games are likely just noise.
- Volume metrics, specifically opportunities (carries plus targets), correlate stronger to next-game fantasy scoring than any efficiency metric for running back. Stats such as touchdown rate or yards per touch carry virtually no weight when predicting a running back’s future fantasy performance.
- We want running backs that are going to be on winning teams but treating point spreads as a certainty can be dangerous. In terms of betting odds, home favorites are the MOST LIKELY to produce high-scoring games but point spreads should come second to chasing volume when choosing a running back player pool. For tournaments, there may even be value in targeting high-volume backs that are road underdogs.
- Salary-based scoring expectations show that paying up at running back is often a profitable strategy. A non-linear expected points model allows 4for4 subscribers to see value across positions in an apples-to-apples manner and often shows that even the highest-priced backs are still the best values.
- In tournaments, winning lineups have paid up for at least one running back and one back with relatively high expected ownership—oftentimes that back is both. The strategy for the second required running back varies some but it’s rare that winning tournament lineups use cheap, super-contrarian backs in one of the required running back slots.
- If there are cheap, contrarian running backs in your GPP player pool, they are usually best used as the flex, not one of the primary running back options. Winning lineups rarely contain two such backs.
- Whether or not to flex a running back in tournaments is week-dependent, and should be used about half the time on DraftKings. In tournaments on FanDuel, your flex position should be weighted towards running backs but not by an overwhelming majority.
Thank you to Sam Hoopen for compiling the data used in this article. Follow Sam on Twitter @SamHoppen.
Footnotes
- While six games is the optimal sample size for running backs, there is a peak after three games and gives us a larger sample size of running back with a continuous rolling average. (Back)
- Note that designations such as RB1 refer to the highest-priced back or back with the highest ownership on each roster. Consequently, the RB1 in terms of salary may not necessarily match up with the RB1 in terms of ownership. (Back)
- For this study, the flex was defined as the lowest-owned RB3 or WR4 on a roster. In practice, the player in the actual flex spot should be the player with the latest starting time possible in order to maximize late-swap options. (Back)


