Week 11 DraftKings & FanDuel Winning GPP Lineup Review

In this space each week, I will review the winning lineups from the DraftKings Millionaire Maker and the FanDuel Sunday Million. Analyzing top lineups can help to tease out lineup-building strategies and offer clues on how you could have landed on a similar team.
DraftKings Week 11 Millionaire Winning Lineup

Ownership
| Week | QB | RB1 | RB2 | WR1 | WR2 | WR3 | TE | Flex | Flex Pos | DEF | Cumulative |
|---|---|---|---|---|---|---|---|---|---|---|---|
| 1 | 5.8% | 15.1% | 9.7% | 23.6% | 16.9% | 5.7% | 3.7% | 2.2% | WR | 35.5% | 118.2% |
| 2 | 3.3% | 15.8% | 9.5% | 11.7% | 11.0% | 6.1% | 5.0% | 8.4% | RB | 9.8% | 80.6% |
| 3 | 3.7% | 20.4% | 16.2% | 22.8% | 20.6% | 15.7% | 9.3% | 11.0% | WR | 12.3% | 132.0% |
| 4 | 6.1% | 24.4% | 3.3% | 29.3% | 12.6% | 6.7% | 14.7% | 0.3% | WR | 6.2% | 103.6% |
| 5 | 6.2% | 44.6% | 31.2% | 20.0% | 15.8% | 4.3% | 5.6% | 31.1% | RB | 8.5% | 167.3% |
| 6 | 4.2% | 54.8% | 18.9% | 19.7% | 10.8% | 4.6% | 9.3% | 1.3% | WR | 3.4% | 127.0% |
| 7 | 11.6% | 15.5% | 10.3% | 12.4% | 4.4% | 2.3% | 19.8% | 17.9% | TE | 12.8% | 107.0% |
| 8 | 6.4% | 45.1% | 29.7% | 27.1% | 7.8% | 5.4% | 19.5% | 0.9% | WR | 8.6% | 150.5% |
| 9 | 6.9% | 17.7% | 15.7% | 34.9% | 6.8% | 3.7% | 5.7% | 10.1% | RB | 11.5% | 113.0% |
| 10 | 7.6% | 21.4% | 13.7% | 12.9% | 8.0% | 1.6% | 19.6% | 6.1% | TE | 11.8% | 102.7% |
| 11 | 14.5% | 41.8% | 28.9% | 34.5% | 24.2% | 17.8% | 9.0% | 1.5% | WR | 9.2% | 181.4% |
| AVG | 6.9% | 28.8% | 17.0% | 22.6% | 12.6% | 6.7% | 11.0% | 8.3% | 11.8% | 125.8% | |
| 2022 AVG | 9.7% | 22.2% | 11.2% | 20.3% | 12.6% | 8.3% | 8.5% | 6.1% | 9.9% | 108.7% | |
| 2021 AVG | 7.6% | 19.7% | 9.5% | 17.8% | 11.8% | 7.6% | 10.0% | 4.4% | 7.1% | 95.3% | |
| 2020 AVG | 9.1% | 24.0% | 9.8% | 18.0% | 13.5% | 8.7% | 8.8% | 4.2% | 10.9% | 106.9% | |
| 2019 AVG | 7.8% | 26.7% | 14.5% | 19.7% | 10.3% | 6.6% | 12.6% | 7.9% | 11.1% | 117.4% |
Only one winning Millionaire lineup since the start of 2019 had higher cumulative ownership than this week’s winner. It was the fifth winner in that span with at least four players at 20% or higher.
Stacks
| Week | Primary Stack | Secondary Stack | Third Stack | Correlated Players |
|---|---|---|---|---|
| 1 | QB/WR/Opp RB | 3 | ||
| 2 | QB/RB/TE | RB/DEF | RB/Opp WR | 7 |
| 3 | QB/TE | RB/WR | 4 | |
| 4 | QB/WR | RB/Opp WR | WR/Opp TE | 6 |
| 5 | QB/WR | RB/DEF | RB/Opp WR | 6 |
| 6 | QB/WR/TE | RB/WR | 5 | |
| 7 | QB/TE | RB/Opp TE | 4 | |
| 8 | QB/WR/WR | 3 | ||
| 9 | QB/WR/WR/TE/Opp RB | 5 | ||
| 10 | QB/WR/WR | TE/DEF | 5 | |
| 11 | RB/WR | WR/TE | 4 |
Since Week 1 2020, only two other Millionaire winners used an unstacked quarterback, however, both of those quarterbacks rushed for at least 50 yards and at least one touchdown.
Flex
Top-1% lineups flexed a tight end 18% of the time, compared to 30% for the whole field. Prior to Week 11, the highest rate of tight ends in the flex this year was 21%. Lineups in the top 1% flexed a wide receiver 46% of the time and running back 36% of the time, compared to 41% and 29% for the field.
Leverage/Unique Builds
Other than not stacking the quarterback—which itself is a way to be unique—Khalil Shakir was a salary pivot off of Rondale Moore, who had a similar salary at 19% ownership. Shakir also added correlation with Dalton Kincaid in a lineup that didn’t correlate with the quarterback.
FanDuel Week 11 Sunday Million Winning Lineup

Ownership
| Week | QB | RB1 | RB2 | WR1 | WR2 | WR3 | TE | Flex | Flex Pos | DEF | Cumulative |
|---|---|---|---|---|---|---|---|---|---|---|---|
| 1 | 4.3% | 20.2% | 14.9% | 23.3% | 20.0% | 4.0% | 10.9% | 0.6% | WR | 1.2% | 99.4% |
| 2 | 2.2% | 13.1% | 10.8% | 11.3% | 10.7% | 7.1% | 6.4% | 3.3% | RB | 30.5% | 95.4% |
| 3 | 26.4% | 29.7% | 17.4% | 10.7% | 8.7% | 8.2% | 14.0% | 13.6% | RB | 4.1% | 132.8% |
| 4 | 10.0% | 27.1% | 4.2% | 10.3% | 8.0% | 1.2% | 5.4% | 2.2% | RB | 5.5% | 73.9% |
| 5 | 6.7% | 29.8% | 14.5% | 13.9% | 12.3% | 10.3% | 26.7% | 6.7% | TE | 8.7% | 129.6% |
| 6 | 11.3% | 28.8% | 20.6% | 25.6% | 11.7% | 9.4% | 2.6% | 14.7% | RB | 10.1% | 134.8% |
| 7 | 13.8% | 29.8% | 18.0% | 12.2% | 6.2% | 4.0% | 22.8% | 7.8% | RB | 4.4% | 119.0% |
| 8 | 6.3% | 18.7% | 9.4% | 17.3% | 8.6% | 7.1% | 16.0% | 4.7% | RB | 3.4% | 91.5% |
| 9 | 7.0% | 25.7% | 6.2% | 22.3% | 17.3% | 15.7% | 7.5% | 9.0% | WR | 20.6% | 131.3% |
| 10 | 9.6% | 15.5% | 12.2% | 15.5% | 7.9% | 2.2% | 1.7% | 9.7% | RB | 3.0% | 77.3% |
| 11 | 10.4% | 38.2% | 30.4% | 29.6% | 19.3% | 10.3% | 5.5% | 0.7% | WR | 7.9% | 152.3% |
| AVG | 9.8% | 25.1% | 14.4% | 17.5% | 11.9% | 7.2% | 10.9% | 6.6% | 9.0% | 112.5% | |
| 2022 AVG | 9.2% | 26.0% | 14.2% | 24.2% | 14.3% | 8.8% | 6.3% | 6.1% | 6.8% | 115.8% | |
| 2021 AVG | 8.5% | 24.0% | 11.0% | 18.3% | 11.2% | 6.3% | 9.9% | 5.3% | 6.2% | 100.7% | |
| 2020 AVG | 10.5% | 23.5% | 10.2% | 18.7% | 11.0% | 8.6% | 16.1% | 5.6% | 7.3% | 111.5% | |
| 2019 AVG | 12.4% | 27.9% | 15.2% | 21.1% | 13.6% | 7.5% | 12.5% | 8.1% | 9.6% | 127.8% |
Stacks
| Week | Primary Stack | Secondary Stack | Third Stack | Fourth Stack | Correlated Players |
|---|---|---|---|---|---|
| 1 | 0 | ||||
| 2 | QB/TE | RB/DEF | 4 | ||
| 3 | QB/Opp WR | RB/Opp WR | RB/Opp WR | 6 | |
| 4 | QB/WR/TE | RB/Opp WR | 5 | ||
| 5 | QB/WR | RB/DEF | WR/Opp TE | WR/Opp TE | 8 |
| 6 | QB/RB/Opp RB/Opp WR | RB/Opp WR | 6 | ||
| 7 | QB/Opp RB/Opp WR | RB/DEF | WR/Opp TE | 7 | |
| 8 | QB/WR | RB/DEF | 4 | ||
| 9 | QB/WR/WR/TE/Opp RB | WR/DEF | 7 | ||
| 10 | QB/WR/WR | RB/DEF | 5 | ||
| 11 | QB/WR/TE | RB/DEF | RB/WR | 7 |
Leverage/Unique Builds
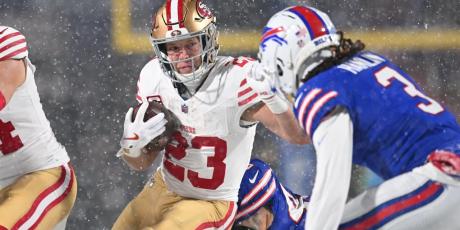
Playing George Kittle added a unique element to a relatively popular stack of Brock Purdy and Brandon Aiyuk. Paying all the way up at tight end led to a unique roster construction in a week where none of the four tight ends priced at $6,000 or above projected for double-digit ownership.
Most teams that punted wide receiver did so with Cardinals or Texans players, making Khalil Shakir a price pivot off of those players.


