Taking Advantage of Recent Trends in RB Fantasy Production

Change is constant in the NFL. Teams experiment with new ways to gain an advantage, and those that succeed are quickly and widely copied. Today, even casual fans are aware of trends such as the league continuing to become more pass-heavy and featured backs being replaced by committees. In this article, we look at current trends in fantasy production and consider how our strategy should adapt them.
Current Trends in Fantasy Production
Let's start off by discussing the two trends mentioned above and their impact on RB production. While the move to a committee would hurt a featured back, it is clearly good news for the secondary RB on that team. And while the trend to more passing clearly hurts both RBs, it hurts the featured back more than the secondary RB.
To see this, consider a team that moves from a balanced offense (50% pass, 50% rush) to a more pass-heavy offense with 60% passing. A featured back expecting, say, 18 carries per game before would see his carries decrease to 15 per game. In contrast, the secondary RB of a committee expecting, say, 8 carries per game would see his decrease to 6.7. In this example, as the team becomes more pass-heavy, the featured back loses 3 carries per game versus only 1.3 for the secondary back.
We can see that these two trends, while harmful to featured backs, either actually help secondary backs or at least do not hurt them as much on a points-per-game basis. With that in mind, we might expect not only that the top backs are scoring fewer points but also that the gap between the top backs and the others is decreasing.
That's enough of the hypotheticals, though. Let's see what the data says.
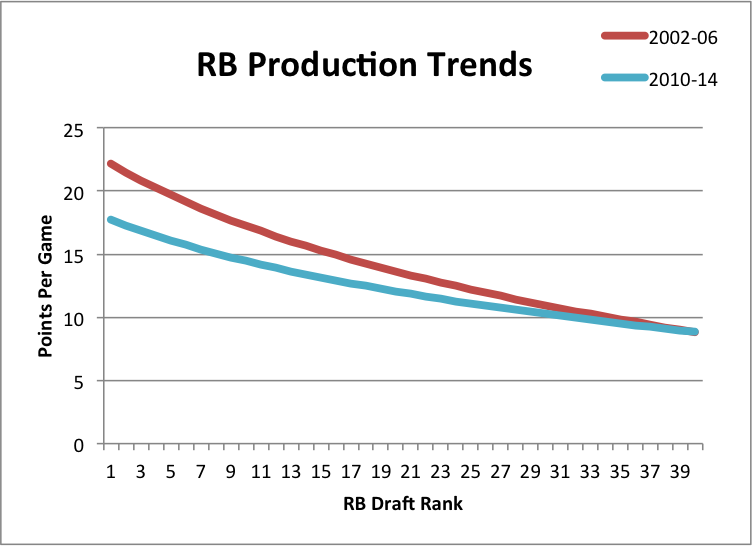
The following figure shows the total fantasy points scored by the 1st through 40th RB off the board according to ADP. The red curve shows the trend from the average of the points of these RBs over a 5 year period centered 10 years ago in 2005. The blue curve shows the trend from the average of the points of these RBs over the last 5 years. [1]

As expected, we can see that the early-round RBs have decreased their fantasy production by much more than later-round RBs. While the curve has shifted down, it has also become flatter, which means the gap between early- and later-round RBs has shrunk.
RB is not the only position seeing a change in the fantasy production versus draft rank curve. QB, WR, and TE are changing as well, but in the opposite way: the curve is shifting up and getting steeper. This means that the gap between early- and later-round picks at these positions is growing.
The following table shows how points for early picks and late picks at these positions have been changing each year on average over the last 13 seasons. The early pick for each position is the 5th of that position off the board. The late pick is the 15th QB, 40th RB, 50th WR, and 15th TE.
| Pos | Early | Late | Gap |
|---|---|---|---|
| QB | +0.36 | +0.26 | +0.10 |
| RB | -0.40 | +0.00 | -0.40 |
| WR | +0.07 | -0.03 | +0.10 |
| TE | +0.28 | +0.24 | +0.04 |
While the gap in points per game between early and late round RBs has been shrinking by -0.4 points per game, the gap for QBs, WRs, and TEs has actually been growing. That said, the change for RBs is four times as large as that of QBs and WRs (and ten times as large as TEs), so the trend for RB production is by far the most important to pay attention to.
Implications for Draft Strategy
For those of us following a value-based drafting strategy, the trend in RB production has clear implications: we should be drafting RBs later because the "value" (the gap in projected points between early and late round picks) has decreased.
As I discussed last year, value-based drafting is essentially the equilibrium strategy according to game theory. This suggests that we should see fantasy players using value-based drafting, at least in leagues with players of roughly equal skill and knowledge. In those situations, we should already be seeing fewer RBs taken early and more WRs and TEs.
Of course, if your league mates do not have 4for4 projections themselves, then you have every reason to believe that you have an advantage in knowledge going into the draft. And it may be possible to take advantage of this by deviating from a strict value-based drafting strategy.
While these trends in RB production are already taken into account in 4for4's projections, one way to test whether most drafters have already adjusted to these trends is to compare draft positions estimated from 4for4 projections (by using value-based drafting) to the ADP from actual drafts. When we do this, we see that the later round RBs in general are ranked more highly by 4for4 than by ADP. In particular, while ADP increases by about 3.75 per RB rank (on average), the draft position estimated from 4for4 projections only increases by about 3.15. This means that, once we get to RB20, the 4for4 draft positions are already a full round earlier than their ADP on average.
This suggests that most drafters have not fully adjusted to the change in RB production over recent years and that there is probably substantial value waiting to be picked up in later rounds RBs. One way to take advantage of that is to follow John's example and take wide receivers instead of RBs early in the draft.
Footnotes
[1] These trend curves have an R^2 of around 0.8, so they are a very accurate picture of the raw data.


