FFPC Best Ball Strategy: Roster Construction

There really is no offseason.
Free-agency speculation is in full swing with multiple teams in line for significant shakeups. The storylines are becoming a part of our everyday conversation. Devonta Freeman may need to find a new home. Cam Newton’s future with the Panthers. Will Jameis Winston throw more accurate interceptions now with better eyesight? The unsurprising result is that the values of each hypothetically affected player, and those connected to them, are changing. What’s surprising is that it’s already happening at the beginning of the offseason.
Best-ball season is back with leagues up and running at the FFPC. While their scoring system is unique, the overall strategy remains the same. We’re projecting player value and performance nearly 10 months in advance. Concepts like opportunity cost and optimizing rosters become the strategic underpinnings of our approach to the format. Roster construction is a key component to taking down your league and I’ll be looking at strategies that worked in 2019 and key takeaways that can be applied in 2020.
Roster Construction Win Rates
Once we’re in season, the players speak for our teams. Elite draft picks like Christian McCaffrey or Lamar Jackson headline our rosters, but the full composition complements the high-end production. Roster construction tells the story of how each drafter strategizes from both a granular and high-level view. From between picks, to phases of the draft, even to final construction, our investments at each position played a role in how often we cashed in 2019. Let’s start at the highest level.
| Rank | Percentage of Winning Lineups | QB | RB | WR | TE | DEF | PK |
|---|---|---|---|---|---|---|---|
| 1 | 10.80% | 3 | 7 | 8 | 4 | 3 | 3 |
| 2 | 6.20% | 3 | 6 | 9 | 4 | 3 | 3 |
| 3 | 4.00% | 3 | 8 | 8 | 3 | 3 | 3 |
| 4 | 3.60% | 3 | 7 | 9 | 3 | 3 | 3 |
| 5 | 2.90% | 3 | 8 | 8 | 4 | 2 | 3 |
| 6 | 2.10% | 3 | 8 | 7 | 4 | 3 | 3 |
| 7 | 2.00% | 3 | 7 | 7 | 5 | 3 | 3 |
| 8 | 1.90% | 3 | 7 | 9 | 4 | 2 | 3 |
| 9 | 1.90% | 4 | 6 | 10 | 4 | 2 | 2 |
| 10 | 1.90% | 3 | 6 | 10 | 3 | 3 | 3 |
| 11 | 1.80% | 2 | 7 | 9 | 4 | 3 | 3 |
| 12 | 1.70% | 3 | 8 | 9 | 4 | 2 | 2 |
Hit rates help us isolate commonalities across an entire field. While the constructions listed aren’t the only strategies employed by drafters in 2019, it does emphasize the most common builds used by league winners. It helps us find trends and takeaways we can apply in 2020 to optimally build our teams. A few stand out in reviewing the Top-12 constructions.
Onesie positions are typically approached in a risk-averse manner. Acquire the minimum amount to field a roster throughout the season while balancing consistent production with upside. Two quarterbacks with offset bye weeks would logically be the optimal approach to the position, but this clearly wasn’t the case to win at the FFPC. Roster constructions with just two quarterbacks appear only once in the top 12 builds with a meager 2.6% hit rate. An easy explanation would be the number of injuries at quarterback in 2019. Patrick Mahomes dislocates his kneecap. Drew Brees tore ligaments in his thumb. Ben Roethlisberger’s elbow kept him on the sideline. In 2019, 58 different quarterbacks started a game for their respective teams and 73 recorded in-game stats during the season. However, that’s not significantly greater than what’s occurred in years past.
- 2018: 55 started with 74 recording stats
- 2017: 56 started with 75 recording stats
- 2016: 54 started with 73 recording stats
- 2015: 53 started with 76 recording stats
Weekly quarterback scoring is volatile. The average coefficient of variation, a measure of relative variability between values, for quarterback scoring was 45.9% indicating a high dispersion rate week to week for every quaretrback in the league. It's important to note that the FFPC has a 28-round draft. With the amount of depth typically drafted at other positions, an additional quarterback may be the sharp move to account for roster space used elsewhere. Regardless, while two quarterbacks allow for another investment elsewhere, the variability at the position coupled with its high output makes the extra investment critical to success.
This was also true with tight-ends. The TE-Premium scoring native to FFPC boosted the positional ADP, but the underlying conventional approach was like quarterbacks. Minimize risk. Maximize value. However, the same volatility exists within weekly tight end scoring lending itself to drafting at least three to secure a victory. With TEs also considered in the FLEX position, having multiple starters on hand remains a viable strategy headed into 2020.
The fantasy community has its annual debate on the merits of fragility during drafts. ‘Zero-RB’ or ‘Hyperfragile’ strategies look to leverage the PPR format with greater investments at wide receiver. However, results indicate a balanced approach was key here. Only 25% of the top 12 constructions featured rosters with all the picks at running back or wide receiver equating to 40% or less of the total across both positions. While teams may have skewed towards wide receivers, that differential was two at most for the majority. So, while player performances or general trends from 2019 may lead us to favor a position, our overall rosters should reflect a balanced approach to secure high-scoring rosters throughout the entire season. Now let’s take a more granular look at drafting.
Early Rounds
The early rounds garner the most attention. The most popular players fly off the board generating some of the largest arguments over player value. Think back to the Damien Williams debate from the last offseason. It wasn’t necessarily about his talent. It certainly wasn’t about his situation. But when he was propelled into the third round he became an instant risk at cost. How we handle the early rounds sets up our moves later in the draft and 2019 league winners had more clues to give us.
| Rank | Percentage of Winning Lineups | QB | RB | WR | TE | DEF | PK |
|---|---|---|---|---|---|---|---|
| 1 | 19.50% | 0 | 3 | 2 | 1 | 0 | 0 |
| 2 | 14.50% | 0 | 2 | 3 | 1 | 0 | 0 |
| 3 | 12.40% | 0 | 3 | 3 | 0 | 0 | 0 |
| 4 | 7.00% | 0 | 4 | 2 | 1 | 0 | 0 |
| 5 | 5.40% | 0 | 2 | 4 | 1 | 0 | 0 |
| 6 | 5.10% | 0 | 2 | 2 | 2 | 0 | 0 |
| 7 | 5.00% | 0 | 4 | 1 | 1 | 0 | 0 |
| 8 | 4.10% | 0 | 3 | 1 | 2 | 0 | 0 |
| 9 | 3.80% | 1 | 3 | 2 | 0 | 0 | 0 |
| 10 | 3.80% | 0 | 6 | 0 | 0 | 0 | 0 |
| 11 | 2.90% | 0 | 1 | 4 | 1 | 0 | 0 |
| 12 | 2.80% | 1 | 2 | 2 | 1 | 0 | 0 |
Late-round drafters rejoice. Drafting a quarterback within the first six rounds (e.g. Patrick Mahomes or Deshaun Watson) hit at the first- and fourth-lowest rate across the 12 combinations sampled. We discussed quarterback volatility in the previous section noting its effect at the highest level of drafting. It’s amplified here as opportunity cost becomes a critical component for winning your league. Despite usually needing three quarterbacks to win, the data indicates a mid or late-round approach is the optimal approach.
Despite the balance between wide receivers and running backs at the general level, we see more stances taken in the early rounds. Here we see 50% of the top 12 dedicating over half of their early-round draft capital towards wide receivers or running backs. Specific players or their situations become the tiebreaker causing the imbalance and forcing augmented strategies later. We also see the uniqueness of TE-premium leagues come into play. At least one tight end was drafted within the first six rounds for 75% of the top 12 early-round constructions. While the names are all too common (e.g. Kelce, Ertz, Kittle), the leveraged gained by making the single investment early paid dividends as other shots at the position could be taken later to strengthen the roster. With 22 more rounds ahead, more flexibility could be gained by drafting optimally early. These trends emphasize the importance of opportunity cost and its effect on our overall output. It can be hard to see the forest for the trees during the draft with players and enticing situations to consider. However, expected output declines per round and we should plan accordingly.
Opportunity Cost
‘You can’t win your league in the first round, but you can lose it.’
An age-old adage that’s repeated and refuted year over year. However, the data does give it some teeth.
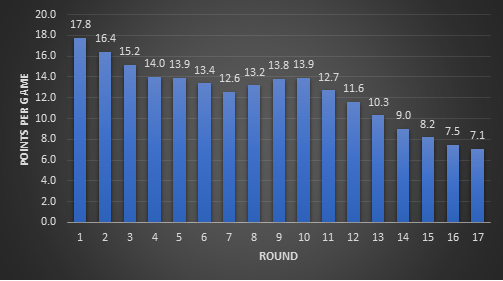
2019 FFPC Average Points Per Game by Round

The 4.4 PPG drop-off from Round 1 to Round 6 should alter our perception of risk in this phase of the draft. Running backs and (some) wide receivers with more stability in their production profiles become the easier selection over a quarterback. The risk is too great to pass up running backs and receivers early with the likelihood of finding similar production later decreasing each round. However, this data is just a single sample. To verify this idea, a similar average was taken over a three-year sample looking at redraft leagues.
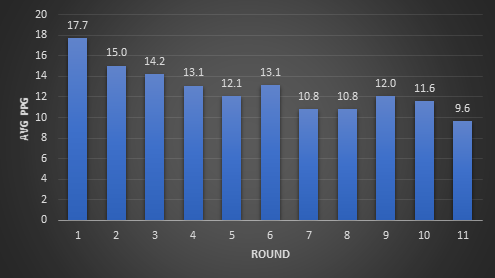
2017-2019 Redraft League Average Points Per Game by Round

A similar trend exists outside of the FFPC strengthening the idea that a focus on the core positions (RB, WR, and TE) is a viable strategy worth considering in 2020. Injuries and statistical regression are typical occurrences affecting quarterbacks and increasing their risk. With so many available (during the draft and throughout the season), establishing a foundation of pass-catchers and running backs will afford a stronger roster boosting our chances of winning.
The Bottom Line
Best-ball drafts are meant to be fun and simple. We're drafting for an entire season! Even in the early stages of the offseason we can remember the rollercoaster that is the regular season. Injuries, trades, and regression are events we can adjust to in other formats. In best-ball, we have to insulate ourselves from that potential. Theoretically, it's easier to build cases against players by reviewing their situation. A 31-year old wide receiver switching teams after scoring 15 touchdowns the prior season with an aggressive quarterback carried risk. A running back holding out while seeking a contract extension carried risk. But it's nearly impossible to do map out situations for every player as the news cycle constantly churns throughout the offseason.
Understanding both roster construction and opportunity cost can naturally shield you from risk. Building your team optimally, as shown in the Roster Constructions table, shields you from risk. However, the idea isn't to take a winning build from 2019 and apply it in all of your drafts in 2020. The idea is to capture the guidelines presented within the build itself. Drafting 3 quarterbacks because of the deep, 28-round format on the FFPC. Taking a similar approach to tight-ends because of the premium scoring settings. But quantity isn't (wasn't) everything. As demonstrated in quantifying opportunity cost, we can't just draft 3 quarterbacks in the first 3 rounds and call it a day. When a player is drafted matters just as much as how often their position is selected. With diminishing returns expected as the draft unfolds, outliers and values at ADP become critical to success as we try and adhere to an optimal build.
Special thanks to Kevin Zatloukal for analysis.


