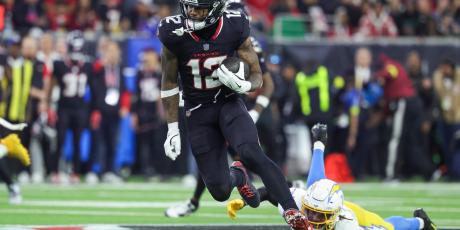
5 Running Back Studs & Duds for 2020

In part one of this series, I uncovered five potential studs or duds at the quarterback position using my updated touchdown expectation model. The introduction in that article lays out the entire methodology for this study but the basic premise is simple—we can find out who scored touchdowns above or below expectation based on the starting field position of every play. Of course, every play type and each position will have a different expectation.
More Studs & Duds: QB | WR | TE
Calculating touchdown expectation for running backs requires extra work since we are often dealing with a significant number of both carries and targets for a player.
The following table lists the touchdown rates for all running back opportunities (carries and targets) over the last three seasons:
| Line of Scrimmage | TD Rate, Rushes | TD Rate, Targets |
|---|---|---|
| 1–49 | 0.3% | 0.3% |
| 50–41 | 0.4% | 0.4% |
| 40–31 | 0.6% | 1.8% |
| 30–21 | 1.4% | 4.8% |
| 20–16 | 3.4% | 7.1% |
| 15–11 | 5.7% | 13.8% |
| 10–6 | 11.0% | 23.9% |
| 5–1 | 41.1% | 39.8% |
After compiling every opportunity for each running back in the league from 2019 (minimum 100 opportunities), I calculated each back’s touchdown expectation and compared that number to the actual touchdowns that they generated. The differential in those numbers will serve as an indicator for running backs who scored more often or less often than they should have and, in turn, potential studs or duds in 2020.

- All Premium Content
- The most Accurate Rankings Since 2010
- Expert Draft Picks w/DraftHero
- Highest Scoring Lineup + Top Available Players w/LeagueSync
- ...and much much more


