The Most Predictable Wide Receiver Stats

Metrics that measure talent are much more important for wide receivers relative to running backs. And in many ways that makes sense. If a coaching staff so chooses, they can give any running back a massive amount of touches. That’s not the case at wide receiver. On a typical pass play, a WR is competing against two other WRs, a TE, and an RB for a target. Talent is necessary to get the volume we need in fantasy football and to be efficient on that volume. Let’s dig into the stats that matter for measuring talent, efficiency, and volume.
More Predictable Stats: QB | RB | TE
Methodology
This analysis considered 23 statistics for wide receivers who earned at least 30 targets in consecutive seasons. Every statistic analyzed is a rate statistic rather than a volume statistic. For example, we’re using yards per route run rather than total yards in a season. This allows us to more easily compare wide receivers with differing opportunities.
As for the time period, we’re using 2017-2023 for two reasons. The first is some advanced statistics from ESPN Analytics like open score are only available starting in 2017. The second reason is the correlations for the available statistics don’t change drastically if you extend the time period.
Consistent Variables
With that methodology in mind, let’s find out how consistent wide receiver statistics are year-over-year. The table below shows the correlation of a variable between consecutive seasons. What you’ll notice is a few style-based variables like slot rate and average depth of target are near the top. These variables are more indicative of what role a WR plays in the offense and they remain stable year-over-year. If a WR plays a lot in the slot, they tend to continue to do this the following season and this impacts the average depth of their typical target.
However, these variables do not correlate with next season’s fantasy points. That’s because they require additional context. Nathan Jahnke’s recent article Studying Wide Receiver Utilization does a great job of providing this context. For example, WRs that are the primary X-WR in 2-WR sets but move into the slot in 3-WR sets have averaged the most fantasy points of any role. However, if that same WR doesn’t play in 2-WR sets, they score 4.6 fewer fantasy points per game. Slot rate needs to be paired with route rate to be useful.
At the bottom of the table are statistics like contested catch rate and drop rate that come up frequently when disparaging a WR. And neither of them really matters. There is no correlation year-over-year and no predictive power for future fantasy points. If anything, we should target players whose fantasy points were harmed in the prior year by an exceptionally high number of drops or low contested catch rate.
| Variable | Correlation |
|---|---|
| Slot Rate | 0.75 |
| Targets Per Game | 0.70 |
| Fantasy Points Per Game | 0.68 |
| Receptions Per Game | 0.68 |
| Yards Per Game | 0.67 |
| Average Depth of Target | 0.65 |
| Targets Per Route Run | 0.64 |
| Open Score | 0.59 |
| First Downs Per Route Run | 0.58 |
| Average Depth of Completion | 0.57 |
| Yards Per Route Run | 0.56 |
| Yards After Catch Per Reception | 0.48 |
| Points Earned Per Route | 0.43 |
| YAC Score | 0.43 |
| Yards Per Reception | 0.42 |
| Broken and Missed Tackles Per Reception | 0.39 |
| Catch Score | 0.27 |
| On-Target Catch Percentage | 0.22 |
| TD Rate | 0.19 |
| EPA Per Target | 0.18 |
| Drop Rate | 0.14 |
| Contested Catch Rate | 0.02 |
| Route Rate | 0.01 |
Predictive Variables
Now let’s get to the good stuff; what variables help us win fantasy championships. The table below extends our analysis further by comparing the correlation of each variable with a wide receiver’s fantasy points per game in the next season. Just like with running backs, the top of the table is dominated by volume-based statistics. Receiving yards per game in particular is highly predictive for next season’s fantasy points per game. But unlike with running backs, there are some efficiency- and talent-based statistics that narrowly miss the volume stats in terms of predictiveness.
From a talent perspective, the most predictive variable I found was ESPN Analytics’ open score. This variable uses player-tracking data from NFL Next Gen Stats. For each route that a WR runs, an expected amount of separation is calculated by using historical data and the route, coverage, and depth of the particular play. A WR is then given an open score based on their separation relative to the benchmark. The score is standardized to range between zero and 99 where 50 is the league average.
With respect to efficiency, the two most predictive variables are yards per route run (YPRR) and first downs per route run (1DRR). Now these two variables sound very similar and they are. In fact, the correlation between the two is an extremely high 0.91. However, combining YPRR and 1DRR provides useful information on some outlier efficiency numbers that looking solely at YPRR does not.
| Variable | Correlation |
|---|---|
| Fantasy Points Per Game | 0.68 |
| Yards Per Game | 0.67 |
| Targets Per Game | 0.62 |
| Receptions Per Game | 0.61 |
| Yards Per Route Run | 0.59 |
| First Downs Per Route Run | 0.57 |
| Targets Per Route Run | 0.53 |
| Points Earned Per Route | 0.47 |
| Open Score | 0.44 |
| Catch Score | 0.31 |
| EPA Per Target | 0.28 |
| YAC Score | 0.17 |
| Yards Per Reception | 0.15 |
| TD Rate | 0.13 |
| Contested Catch Rate | 0.12 |
| Average Depth of Completion | 0.10 |
| Broken and Missed Tackles Per Reception | 0.10 |
| Average Depth of Target | 0.07 |
| Yards After Catch Per Reception | 0.05 |
| On-Target Catch Percentage | 0.05 |
| Route Rate | -0.05 |
| Drop Rate | -0.09 |
| Slot Rate | -0.12 |
Talent: Open Score
The starting point for a wide receiver’s future performance expectations is talent. And as mentioned, ESPN Analytics’ open score is both consistent and predictive. The graph below takes a player’s open score along with their yards after the catch (YAC) and catch scores from ESPN Analytics. And then it groups receivers together that win in similar ways. I’m using a method called hierarchical clustering to do this. It’s an unsupervised clustering algorithm, which means I’m not telling the model the group a receiver belongs in but am asking it to create those groups using the data. What results is a set of clusters (five in this case) where the players within each cluster are generally similar to each other.
It's probably not a surprise that you want your favorite WR to be in the Justin Jefferson cluster. This cluster has a ton of studs like CeeDee Lamb and A.J. Brown. But I’ve found this exercise more useful in past years by highlighting players that are a bit more surprising. For example, this was why I was so high on Brandon Aiyuk prior to last season. This year, some players whose talents aren’t universally loved yet but land in this cluster include Tank Dell and Diontae Johnson (who I’ll talk about more later).
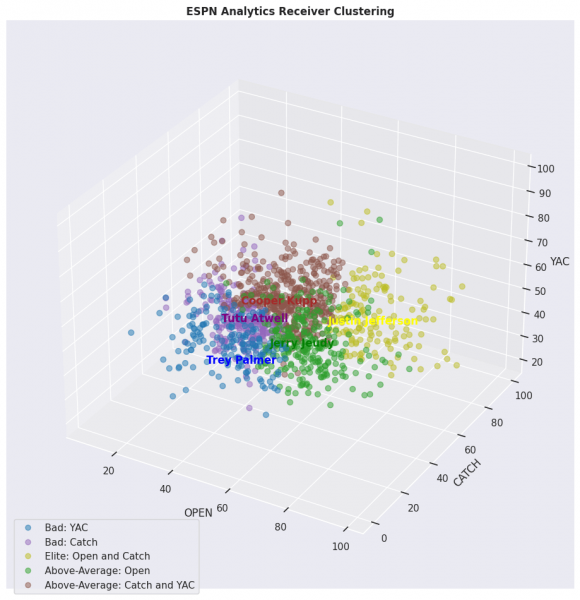
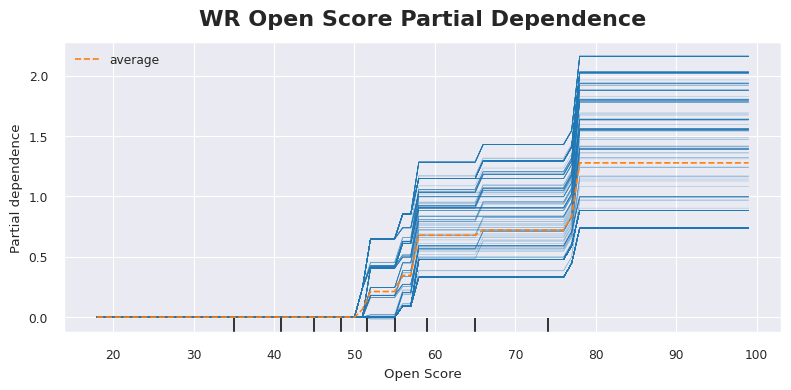
Players in the Justin Jefferson cluster averaged an open score of about 70. And that mirrors what we’re looking for when predicting great future fantasy seasons. The graph below is a partial dependence plot (PDP) of WR open scores. PDPs are a great way to shine some light on the inner workings of machine learning models. They show how each variable affects the model’s predictions while averaging out the effects of the other variables. It’s easiest to focus on the orange line in the graph. As that orange line increases above zero on the y-axis, it means WRs in that range typically score more fantasy points next season. The main takeaway here is we start seeing positive outcomes when a WR’s open score is above 60 and a score above 80 is typically associated with an elite season.
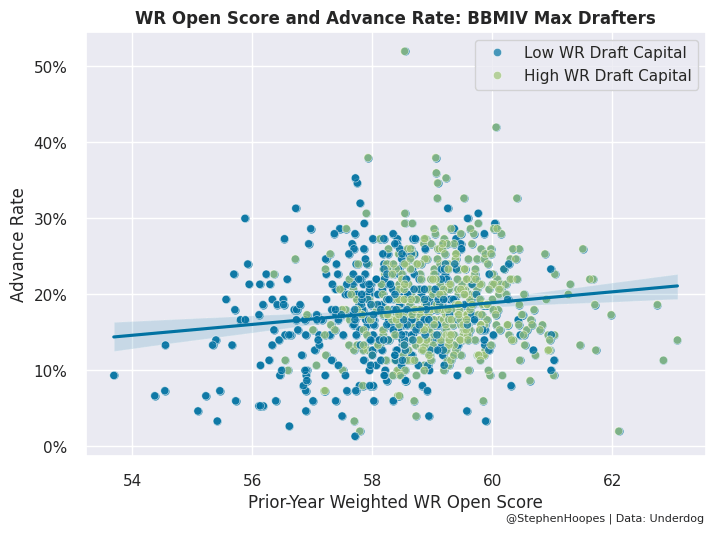
One final point on open score is we can use this to improve our performance in best ball. Each data point in the graph below is a drafter that entered Underdog’s Best Ball Mania IV (BBMIV) 150 times. The x-axis is the average open score for the WRs they drafted. The open scores are from 2022 and weighted by how frequently they drafted each WR. The y-axis is that drafters’ playoff advance rate. It’s a surprisingly strong connection given that we’re only looking at one variable for one position group. And it's even stronger when you filter for drafters that tended to take RB early. So, focusing on WRs that get open in the later rounds of drafts can improve your playoff advance rate, especially if you start a draft with multiple early RBs.
Efficiency: YPRR and 1DRR
To improve our confidence that a WR is talented, we’d like to see that talent manifest in efficiency. As we saw, the efficiency metric that correlates the most with future fantasy points is YPRR. And the best outcomes next season tend to come from WRs that earned at least two yards per route run the prior year. But similar to with rushing yards over expected (RYOE) for running backs, YPRR can be skewed by big plays. With running backs, though, we found that success rate did a poor job of providing additional context. Fortunately, WRs have a success rate metric that is nearly as predictive and more consistent than YPRR.
Ryan Heath has a great article Statistically Significant: First Downs Per Route Run if you’d like to dive more deeply. But the logic is that good WRs tend to generate successful plays more frequently. But the binary nature of a first down caps the benefit that any individual play can have on the statistic. One first down counts the same as any other first down, while a 99-yard reception can heavily skew YPRR. What I’ve found is the best outcomes for future-season fantasy points come from WRs that earn first downs on at least 9.5% of their routes.
Combining both YPRR and 1DRR provides some interesting insight. For the sake of this argument, I’m going to skew the YPRR benchmark we care about down from 2.00 to 1.97. But with that small change, there isn’t a single WR that earned a first down on 9.5%+ of their routes that didn’t hit 1.97 YPRR. However, five WRs had over 2.00 YPRR last season but failed to gain first downs on 9.0% of their routes.
I won’t dive into each of the names included in the table below, but you get a few guys with a lot of designed targets like Deebo Samuel and Jayden Reed, while George Pickens is more of a big-play WR. Kalif Raymond is really interesting, though. On one side, he has elite YPRR and open score marks. On the other hand, he has a red flag on 1DRR and has nowhere near the volume we’re hoping for. But given the additional context I’ll provide on Jameson Williams below, he’s an interesting flyer in the 18th round of Underdog drafts.
| Player | YPRR | 1DRR |
|---|---|---|
| Deebo Samuel | 2.32 | 8.8% |
| George Pickens | 2.11 | 7.6% |
| Christian Kirk | 2.07 | 8.9% |
| Kalif Raymond | 2.07 | 8.5% |
| Jayden Reed | 2.05 | 8.3% |
Volume: Yards Per Game
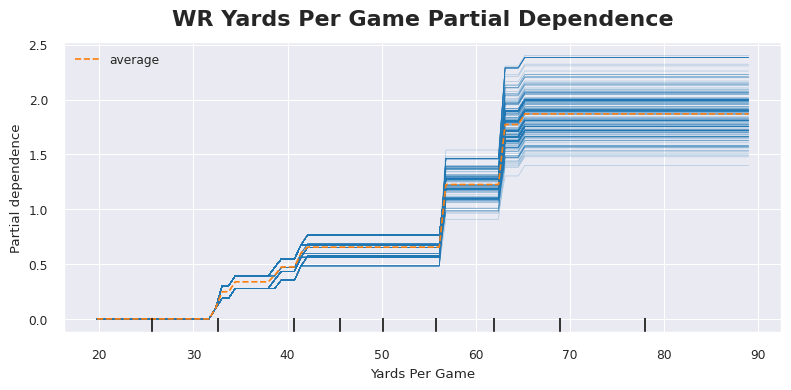
And finally, we need a WR’s talent and efficiency to hold over a large volume of routes and targets. That’s how we get a league-winning WR. Yards per game was slightly less consistent year-over-year compared to targets and receptions, but it was the most predictive for future-season fantasy points. What we see from the PDP below are positive outcomes starting around 40 yards per game but really taking off after 60 yards per game. I’ll dig further into a few of these players below, but the best ADP values among players who earned at least 60 receiving yards last year include Keenan Allen, DeAndre Hopkins, and Chris Godwin.
Wide Receivers Who Stand Out
Keenan Allen and DeAndre Hopkins
Speaking of Keenan Allen, here are his ranks last year in the stats we care about: 1st in open score, 11th in YPRR, 12th in 1DRR, and 4th in yards per game. He is currently the 33rd WR drafted on Underdog. Now, he’s on a new team this season and that brings with it some uncertainty and improved target competition. But the biggest concern is his age. He’ll be 32 years old at the start of the season. However, Dwain McFarland wrote an excellent article How Does Age Impact WR Performance in Fantasy Football. What he found is that elite WRs like Allen age more gracefully than other WRs. With no signs of slowing down, Allen is my most-drafted WR on Underdog.
Similar to Keenan Allen, DeAndre Hopkins is no spring chicken. Yet, people seem to be forgetting just how good he was last year. He cleared all of the elite marks we’re looking for with an 82 open score, 2.09 YPRR, 9.5% 1DRR, and 62 yards per game. Even with the age concerns, there is some upside with the Titans offense potentially passing more. Perhaps the departure of Derrick Henry and the arrival of Calvin Ridley are signals toward a higher pass rate over expectation (PROE). The Titans finished in the bottom five in PROE last season.
Dontayvion Wicks, Packers
The average ADP on Underdog among WRs with an elite 9.5%+ 1DRR is pick 30 or the middle of the third round. Dontayvion Wicks earned one first down on 10.2% of his routes in 2023 and is currently being drafted in the 11th round. Now, there is a reason for that. Among that same group of WRs, he had by far the lowest volume, finishing about 16 yards per game below the next receiver. Additionally, his team has a very crowded depth chart, so there is no guaranteed volume in Green Bay. But with a 2.04 YPRR and an above-average open score, I’m willing to take a bet on Wicks in the 11th round. If you told me only one WR on the Packers turned into an elite player, my money would be on Wicks.
Diontae Johnson, Panthers
After Wicks, Diontae Johnson has the cheapest ADP among WRs that earned elite 1DRR marks in 2023. Additionally, here are Diontae Johnson’s open scores by season: 91, 92, 87, 99, and 78. And he’s joining a team that desperately needed any receiver to get open for Bryce Young last year. We have an ultra-talented player, who has been efficient on his targets, and has the opportunity for a truly massive amount of volume. Why is he available in the 7th round?
Jameson Williams, Lions
The player with by far the biggest difference in my expectations vs his Underdog ADP is Jameson Williams. Now, I’m all for incorporating additional context on a player for their projection. But I’d like to see something that would grant optimism for a breakout rather than just hope. Among the variables we’ve discussed, he has a below-average open score, a decent 1.47 YPRR that is dinged by a very poor 5.8% 1DRR, and only 29.5 yards per game in 2023. Kalif Raymond bests Williams in essentially every metric we care about, plays on the same NFL team, but is undrafted. Alternatively, we need to draft Williams in the 7th round. Williams may very well break out, but the cost you have to pay is far too high relative to the odds.
Jahan Dotson, Commanders
Jahan Dotson took a massive step backward in his sophomore season. His performance declined in every metric we care about relative to his rookie season. He ultimately gained fewer receiving yards despite running 224 more routes. I’m more willing to hold out a candle for him relative to Jameson Williams because we’ve at least seen something to get excited about in the past. But a 38 open score, 0.82 YPRR, and 4.3% 1DRR aren’t close to getting the job done. And now with Jayden Daniels at the helm, we should expect a significant drop in pass rate. Even with a low cost, Dotson isn’t a bet I’m interested in making.
Darnell Mooney, Falcons
Among the WRs that are the most mispriced according to this analysis, Darnell Mooney is the most interesting. His talent, efficiency, and volume metrics are nearly identical to Jahan Dotson’s. And by that I mean, they are not good. But his volume statistics were hurt by a contested catch rate that was half the NFL average and a drop rate that was more than twice the NFL average. As a reminder, neither of those statistics is sticky or predictive of future season fantasy points.
He flashed in 2022 with a 67 open score and a much better YPRR. And with the new Falcons offensive coordinator Zac Robinson, I would expect Mooney to be on the field a lot. The Falcons have a chance to increase their use of 3-WR sets more than any team in the NFL. Hopefully, we’ll even see Mooney used in motion pre-snap to give him some built-in separation. He’s not someone I’m prioritizing given his 2023 stats, but he’s at least interesting.
Bottom Line
• Talent is more predictive of future fantasy points for WRs relative to RBs. We want our WRs to have an open score above 60, with a score above 80 being a bullish sign for an elite fantasy season.
• We want to see WR talent manifest itself in efficiency. With that in mind, we want our WRs to have a YPRR above 2.00 and a 1DRR above 9.5%.
• And ultimately, we want talent and efficiency to hold over a large volume of routes and targets. Yards per game was the most predictive volume stat, with 40 and 60 yards per game being important benchmarks for WRs.