TJ's Take: Week 5 NFL DFS Recap

Reviewing your hits and misses each week is imperative if you want to be a profitable DFS player but examining winning lineups is also a useful exercise in cultivating a winning approach. Week 5’s winning lineups from the biggest contests on FanDuel and DraftKings can be used to tease out lineup-building strategies and offer clues on how you could have landed on a similar team.
This is a free offering in our weekly content contained in the 4for4 DFS subscription. To get access to all of our weekly DFS analysis, sign up here!
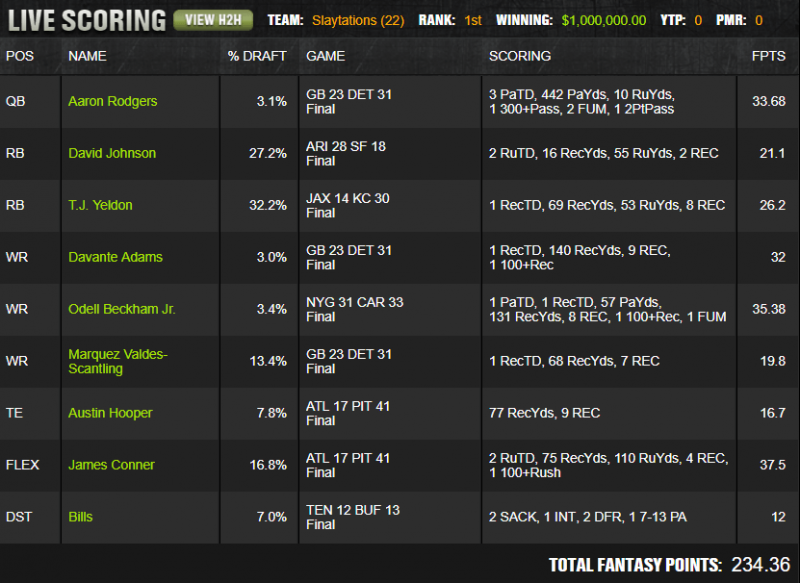
DraftKings Week 5 Millionaire Winning Lineup

Slaystations took down Week 5’s million dollar prize on DraftKings with a three-man Packers stack, offsetting a relatively chalky lineup with three players owned in under five percent of Millionaire lineups. Save the Bills defense, every player found in the winning lineup was featured as a play to be overweight on in last week’s Main Slate Breakdown. Because most of the underowned plays were mentioned in last week’s write up, this is a good time to look at the portfolio of a winning player rather than the lineup in isolation. (Recall that DraftKings allows you to download every lineup from each tournament that you enter. This is a great resource to review winning strategies.)
Of Slaystations’ 35 lineups entered into the Millionaire, 19 included Matthew Stafford as his quarterback. While Slaystations was clearly high on this game, his portfolio reminds us of an important lesson in DFS GPPs—opposing passing games are highly correlated and if we are high on one passing game, it’s often wise to have some exposure to the opposing offense. Slaystations leveraged that correlation by rolling out Packers stacks in just over 10 percent of his lineups. By rotating core plays—Slaystations was overweight on seven of the nine players in his winning lineup—with a favorable stack, this portfolio is a perfect example of a point that Pat James makes each week—it’s easier to hit on contrarian stacks with your core plays than trying to pinpoint multiple individual low-owned plays. Of course, you’ll never be able to cover all of your bases—Slaystations used just six quarterbacks in his portfolio in order to mix in most of his core plays with each stack.
What Were the Indicators for the Low-Owned Plays?
The Bills are arguably the worst offense in the league but antennas should have gone up when they were only three-point underdogs against a team that was 3–1 going into the week. If you’re going to bet on an underdog to win, targeting a home team is usually the savvy move. Going into Week 5, Bills and Titans games both ranked in the bottom 10 in terms of points scored relative to the over/under. With the lowest game total on the main slate, there wasn’t much risk in rostering the home dog, especially when you consider the price savings.
FanDuel Week 5 Sunday Million Winning Lineup

Like DraftKings’ main event winner, jimdole topped the FanDuel Sunday million with a stack that was featured in last week’s Slate Breakdown. As I’ve mentioned in this space before, if you’re going to eat the chalk, it’s usually best to go with the public at running back, since it is the most predictable position. What’s especially notable about running backs in this lineup is that this now makes it five out of five weeks that the Sunday Million winner has used a running back in the flex. This can largely be attributed to FanDuel’s half-PPR scoring system.
What Were the Indicators for the Low-Owned Plays?
In last week’s Projected Ownership Analysis, Pat James noted that Taywan Taylor had seen his snaps and volume climb in recent weeks and that he would likely benefit from Tre’davious White shadowing Corey Davis. Taylor boasted the highest GPP leverage scores on both sites and while the play didn’t hit, this is a reminder that you don’t have to be perfect to take down a large-field tournament. Sometimes, a low-owned play that opens up salary for studs elsewhere is a unique enough play if your expensive players hit their ceilings—in other words, a single stud alone often has a higher ceiling than two middling plays.
The Jets have quietly been shuffling their receiver assignments as the season has progressed, most notably in the slot. Understanding the domino effect here would have taken a keen eye but the writing was on the wall for a big Robby Anderson game sooner rather than later. In recent weeks, Jermaine Kearse had taken over primary slot duties from Quincy Enunwa, meaning Enunwa would start seeing increased snaps against the opposing team’s best cornerback. While Kearse would get the easier targets in the slot, Anderson stood to have the favorable outside matchup with more deep targets—through the first four weeks, Anderson led the team with a 15.2-yard average depth of target. Deep targets are the most efficient for fantasy purposes and the stars aligned for Anderson last week.
Much has been made in recent years of the Steelers’ home/road splits but the Falcons haven’t been the same team outside of a dome. Since the beginning of 2015, Atlanta’s offense has averaged 406 yards and three touchdowns when playing indoors compared to 355 yards and 2.1 touchdowns in games played outside. Pittsburgh was a home favorite with one of the best defensive lines in the league, in terms of getting pressure on the quarterback. Even if the Steelers didn’t hold the Falcons to 17 points, we were reminded in Week 4 by the Raiders that defenses don’t necessarily need to allow a low point total to be fantasy relevant.
TJ’s Final Take
Although we are roughly a third of the way through the season already, five games is still a relatively small sample size. Roles will continue to change in the coming weeks as suspensions are lifted and rookies emerge, but touch share numbers are finally starting to normalize, especially for the pass catchers—running backs see enough volume that we have a good idea of their true workloads relatively early in the season. One or two games with huge target numbers will inflate per game averages and target shares this early in the season but the cream is rising to the top in terms of consistent volume. Through five weeks, there are now only a handful of players that have seen at least 10 targets at least four times.
| Player | Pos | Team | G | W1 | W2 | W3 | W4 | W5 | TGTs | TGTs/G | Times 10+ targets |
|---|---|---|---|---|---|---|---|---|---|---|---|
| Adam Thielen | WR | MIN | 5 | 12 | 13 | 19 | 12 | 10 | 66 | 13.2 | 5 |
| Zach Ertz | TE | PHI | 5 | 10 | 13 | 10 | 14 | 11 | 58 | 11.6 | 5 |
| DeAndre Hopkins | WR | HOU | 5 | 11 | 11 | 10 | 12 | 13 | 57 | 11.4 | 5 |
| Odell Beckham | WR | NYG | 5 | 15 | 9 | 10 | 11 | 14 | 59 | 11.8 | 4 |
| Antonio Brown | WR | PIT | 5 | 16 | 17 | 9 | 11 | 13 | 66 | 13.2 | 4 |
| Jarvis Landry | WR | CLE | 5 | 15 | 7 | 15 | 10 | 10 | 57 | 11.4 | 4 |
| Stefon Diggs | WR | MIN | 5 | 6 | 13 | 10 | 15 | 11 | 55 | 11.0 | 4 |
Last season, only 14 players played more than eight games and averaged at least eight targets per game. Here’s the list of players that have seen eight or more targets at least four times this year.
| Player | Pos | Team | G | W1 | W2 | W3 | W4 | W5 | TGTs | TGTs/G | Times 8+ targets |
|---|---|---|---|---|---|---|---|---|---|---|---|
| Adam Thielen | WR | MIN | 5 | 12 | 13 | 19 | 12 | 10 | 66 | 13.2 | 5 |
| Odell Beckham | WR | NYG | 5 | 15 | 9 | 10 | 11 | 14 | 59 | 11.8 | 5 |
| Zach Ertz | TE | PHI | 5 | 10 | 13 | 10 | 14 | 11 | 58 | 11.6 | 5 |
| DeAndre Hopkins | WR | HOU | 5 | 11 | 11 | 10 | 12 | 13 | 57 | 11.4 | 5 |
| Davante Adams | WR | GB | 5 | 8 | 12 | 9 | 14 | 12 | 55 | 11.0 | 5 |
| A.J. Green | WR | CIN | 5 | 8 | 9 | 8 | 8 | 10 | 43 | 8.6 | 5 |
| Antonio Brown | WR | PIT | 5 | 16 | 17 | 9 | 11 | 13 | 66 | 13.2 | 4 |
| Jarvis Landry | WR | CLE | 5 | 15 | 7 | 15 | 10 | 10 | 57 | 11.4 | 4 |
| Stefon Diggs | WR | MIN | 5 | 6 | 13 | 10 | 15 | 11 | 55 | 11.0 | 4 |
| Julio Jones | WR | ATL | 5 | 19 | 9 | 6 | 12 | 9 | 55 | 11.0 | 4 |
| JuJu Smith-Schuster | WR | PIT | 5 | 8 | 19 | 11 | 11 | 4 | 53 | 10.6 | 4 |
| Golden Tate | WR | DET | 5 | 15 | 13 | 8 | 8 | 7 | 51 | 10.2 | 4 |
| Michael Crabtree | WR | BAL | 5 | 6 | 10 | 10 | 8 | 12 | 46 | 9.2 | 4 |
| Travis Kelce | TE | KC | 5 | 6 | 10 | 10 | 12 | 8 | 46 | 9.2 | 4 |
| Keenan Allen | WR | LAC | 5 | 11 | 8 | 7 | 10 | 9 | 45 | 9.0 | 4 |
| James White | RB | NE | 5 | 9 | 8 | 3 | 10 | 14 | 44 | 8.8 | 4 |
| Quincy Enunwa | WR | NYJ | 5 | 10 | 11 | 8 | 8 | 5 | 42 | 8.4 | 4 |
| Brandin Cooks | WR | LAR | 5 | 8 | 9 | 8 | 8 | 0 | 33 | 6.6 | 4 |
Obviously, past performance is not always indicative of future results, but when building lineups and looking for floor plays—especially this early in the season—consider which players are actually seeing consistent volume and whose totals might still be artificially inflated.
Photo by Mitchell Leff/Getty Images.


