Week 9 DraftKings & FanDuel Winning GPP Lineup Review

In this space each week, I will review the winning lineups from the DraftKings Millionaire Maker and the FanDuel Sunday Million. Analyzing top lineups can help to tease out lineup-building strategies and offer clues on how you could have landed on a similar team.
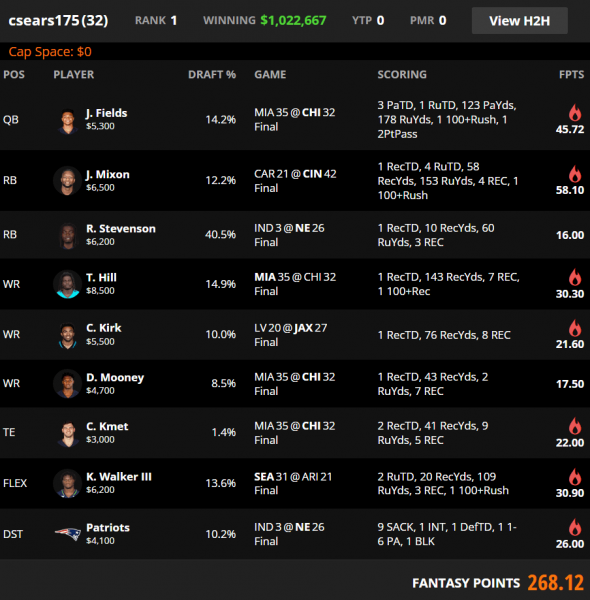
DraftKings Week 9 Millionaire Winning Lineup

Ownership
| Week | QB | RB1 | RB2 | WR1 | WR2 | WR3 | TE | Flex | Flex Pos | DEF | Cumulative |
|---|---|---|---|---|---|---|---|---|---|---|---|
| 1 | 9.1% | 14.2% | 9.3% | 27.1% | 12.5% | 11.2% | 17.2% | 7.9% | WR | 3.0% | 111.5% |
| 2 | 3.6% | 10.4% | 8.4% | 21.3% | 19.7% | 14.4% | 9.2% | 6.3% | WR | 1.8% | 95.1% |
| 3 | 2.3% | 16.0% | 13.9% | 16.9% | 8.8% | 5.6% | 2.6% | 1.4% | WR | 15.7% | 83.2% |
| 4 | 6.8% | 38.0% | 15.2% | 15.4% | 11.4% | 5.7% | 19.8% | 6.1% | RB | 3.3% | 121.7% |
| 5 | 12.1% | 14.1% | 13.9% | 27.0% | 13.4% | 7.5% | 7.8% | 9.6% | RB | 22.7% | 128.1% |
| 6 | 4.4% | 12.7% | 8.5% | 14.7% | 4.9% | 3.2% | 2.6% | 2.4% | WR | 0.6% | 54.0% |
| 7 | 17.0% | 46.7% | 32.1% | 15.4% | 2.6% | 2.1% | 8.1% | 21.4% | RB | 43.8% | 189.2% |
| 8 | 21.1% | 50.9% | 12.5% | 27.6% | 28.8% | 26.4% | 1.6% | 7.4% | WR | 0.9% | 177.2% |
| 9 | 14.2% | 40.5% | 13.6% | 14.9% | 10.0% | 8.5% | 1.4% | 12.2% | RB | 10.2% | 125.5% |
| AVG | 10.1% | 27.1% | 14.2% | 20.0% | 12.5% | 9.4% | 7.8% | 8.3% | 11.3% | 120.6% |
The cumulative ownership of 125.5% for this week’s winning lineup was slightly higher than the average winning lineup this season.
This week’s winning lineup had just two players under 10%, the lowest mark for any winner this year. It was just the third time since the beginning of 2019 that the Millionaire winner used fewer than three sub-10% players.
Stacks
| Week | Primary Stack | Secondary Stack | Third Stack | Correlated Players |
|---|---|---|---|---|
| 1 | QB/TE | RB/Opp WR | WR/Opp WR | 6 |
| 2 | QB/WR/WR/Opp TE | 4 | ||
| 3 | QB/TE | RB/Opp WR | 4 | |
| 4 | QB/WR/WR/Opp RB/Opp WR/Opp TE | 6 | ||
| 5 | QB/WR | RB/WR/TE | WR/Opp WR | 7 |
| 6 | QB/WR/Opp RB | 3 | ||
| 7 | QB/WR/TE | RB/Opp RB | 5 | |
| 8 | QB/WR/WR | RB/DEF | WR/TE | 7 |
| 9 | QB/WR/TE/Opp WR | RB/DEF | 6 |
A bring-back was used in the primary quarterback stack for the fourth time this year but it was the third time that it was done opposite a double stack.
For the sixth time this season, The Millionaire Maker winners used a running back mini-correlation.
Every winner except for one this year has used some form of correlation with their tight end.
Flex
The winning lineup flexed a running back in Week 9 along with 62% of top-1% lineups. The field only flexed a running back 41% of the time. While top-1% lineups only used a flex 8% of the time, the field did so at nearly twice the rate.
These trends are somewhat consistent across this season so far.
| Week | RB (Field) | WR (Field) | TE (Field) | RB (Top 1%) | WR (Top 1%) | TE (Top 1%) |
|---|---|---|---|---|---|---|
| 1 | 33 | 53 | 14 | 20 | 67 | 13 |
| 2 | 32 | 58 | 10 | 11 | 76 | 13 |
| 3 | 16 | 65 | 19 | 14 | 74 | 12 |
| 4 | 29 | 55 | 16 | 50 | 41 | 9 |
| 5 | 30 | 51 | 19 | 44 | 44 | 12 |
| 6 | 39 | 44 | 17 | 44 | 39 | 17 |
| 7 | 39 | 38 | 23 | 54 | 26 | 20 |
| 8 | 41 | 43 | 16 | 54 | 30 | 16 |
| 9 | 41 | 42 | 17 | 62 | 30 | 8 |
| AVG | 33.3 | 49.9 | 16.8 | 39.2 | 47.4 | 13.3 |
Leverage
Both sub-10% players on this team were stacked with their quarterback, making the primary stack extra unique around relatively popular players throughout the rest of the lineup. Finding a contrarian $3K tight end proved to be key in a week where a handful of tight ends in that salary range were expected to carry double-digit ownership.
FanDuel Week 9 Sunday Million Winning Lineup

Ownership
| Week | QB | RB1 | RB2 | WR1 | WR2 | WR3 | TE | Flex | Flex Pos | DEF | Cumulative |
|---|---|---|---|---|---|---|---|---|---|---|---|
| 1 | 9.9% | 17.7% | 9.1% | 17.4% | 12.6% | 6.2% | 14.5% | 1.2% | RB | 2.8% | 91.4% |
| 2 | 3.0% | 7.9% | 2.8% | 9.9% | 6.4% | 5.9% | 8.7% | 0.5% | WR | 4.6% | 49.7% |
| 3 | 4.4% | 15.0% | 5.0% | 15.6% | 5.6% | 4.2% | 4.1% | 1.9% | RB | 6.6% | 62.4% |
| 4 | 2.2% | 31.2% | 12.8% | 11.7% | 7.6% | 7.6% | 20.1% | 3.9% | RB | 4.8% | 101.9% |
| 5 | 17.8% | 17.4% | 13.0% | 22.7% | 14.7% | 0.9% | 3.8% | 6.3% | RB | 4.6% | 101.2% |
| 6 | 4.2% | 29.8% | 2.9% | 13.7% | 4.3% | 4.0% | 0.4% | 0.7% | WR | 8.0% | 68.0% |
| 7 | 16.2% | 25.1% | 22.6% | 17.5% | 5.4% | 4.0% | 11.3% | 16.0% | RB | 2.9% | 121.0% |
| 8 | 22.7% | 61.6% | 14.9% | 25.7% | 23.0% | 10.3% | 7.7% | 14.3% | RB | 17.0% | 197.2% |
| 9 | 7.2% | 31.1% | 8.8% | 16.0% | 12.1% | 4.3% | 1.1% | 6.4% | RB | 11.6% | 98.6% |
| AVG | 9.7% | 26.3% | 10.2% | 16.7% | 10.2% | 5.3% | 8.0% | 5.7% | 7.0% | 99.0% |
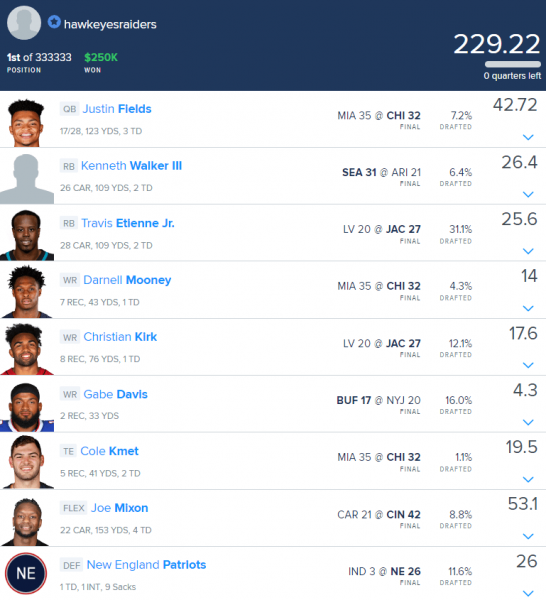
With five players under 10%, this lineup’s cumulative ownership of 98.6% was almost exactly at the average 99.0% of all winners this year.
On average, 2022 Sunday Million winners have used six sub-10% players and four sub-5% players.
Stacks
| Week | Primary Stack | Secondary Stack | Third Stack | Correlated Players |
|---|---|---|---|---|
| 1 | QB/TE | 2 | ||
| 2 | QB/WR/WR/Opp TE | RB/Opp WR | 6 | |
| 3 | QB/TE | RB/WR/DEF | RB/WR | 7 |
| 4 | QB/RB/WR/TE/Opp WR | RB/WR | 7 | |
| 5 | QB/WR/WR | RB/TE | 5 | |
| 6 | QB/WR | WR/TE | 4 | |
| 7 | QB/WR/WR | 3 | ||
| 8 | RB/WR | WR/Opp WR/Opp TE | 5 | |
| 9 | QB/WR/TE | RB/WR | 5 |
For the first time since Week 4, the Sunday Million winner stacked a tight end with their quarterback but eight of the nine winners have correlated their tight end with some player in their lineup.
Since the beginning of 2020, 82% of Sunday Million winners have correlated at least one running back to another player in their lineup.
Flex
From 2019–2021, 58% of Sunday Million winners flexed a running back but that number is way up so far this season with seven of nine winners using three running backs.
Note that this user did not put their latest possible player in the flex, something that should always be done to maximize late-swap flexibility.
Leverage
In addition to a low-owned stack, this lineup used a low-owned running back opposite a Cardinals passing attack that was expected to draw heavy ownership.


