Thanksgiving Day Single-Game NFL DFS: Top FanDuel & DraftKings Plays for Packers at Lions

Welcome to the showdown breakdown for Thanksgiving football, Game 1, featuring a clash between NFC North rivals. The Packers—after a win against the Chargers—are clinging to playoff relevancy at 4-6, and should consider this divisional game a must-win. Meanwhile, Detroit is sitting at 9-2 and needs a win and a slip-up by Philadelphia against the Bills to take over first place in the NFC standings. Let’s dive into this intriguing one-game slate.
Game Environment

This chart represents the general offensive strategies for each team when the game outcome is still in question (win probability between 20% and 80%). The final two minutes of each half are also excluded. We’ll include last year’s statistics through Week 4 of the regular season. Teams in the upper-right quadrant pass more often and play faster than the average NFL team in neutral game scripts, and conversely, teams in the lower-left quadrant play slower and run more often than the average NFL team.
Packers (+7.5, 20) @ Lions (-7.5, 27.5); Over/Under 47.5
Both teams play slower than league average in neutral game scripts. The Lions are as reliant on the run (and their running backs, in general) as any team in the NFL right now, but are just middle of the pack in terms of rush rate in neutral game scripts compared to the NFL average. The Lions are comfortable passing heavily when trailing, which has resulted in a top-10 pass plays per game rate, despite their middling ranking when games are close. The Lions are outside the top 15 teams in deep pass attempts and red zone pass attempts per game, which is a key divergence from the Packers, who rank in the top five in both categories this season, and 10th in overall pace of play, dictated primarily by their bottom-10 average score differential in the NFL.
Quarterback Analysis

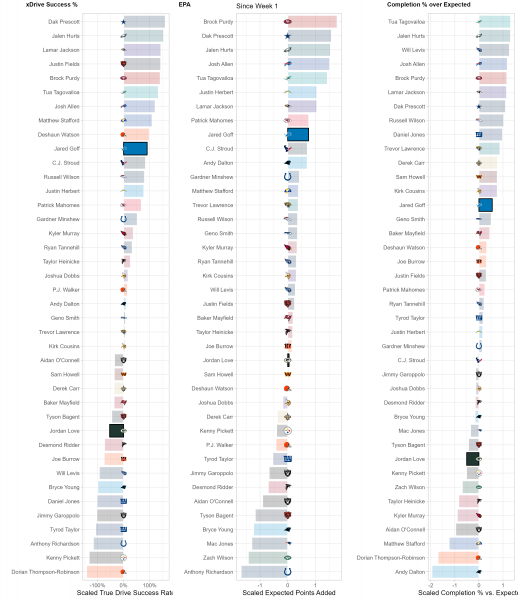
While there may be 22 people on the field for every play, each play and game is heavily dictated by the performance of each team’s quarterback. While efficiency isn’t everything for quarterbacks, it is the best indicator of future performance, so we use a trio of metrics to suss out top performers at the position compared to lackluster ones. xDrive Success %, or True Drive Success Rate, is a measurement of a QB’s ability to turn drives into scores weighted by sample size. EPA or Expected Points Added, is a measurement of the QB’s contribution, both running and throwing, to the team’s scoring and production vs. the average NFL team. Completion % over Expected (CPOE)represents the accuracy and efficiency of a QB’s passes compared to league expectations.
While Jordan Love is improving as a passer as the season goes on, his season-long numbers are subpar, as he ranks below average in per-pass, per-drive, and per-game efficiency this season. After averaging seven yards per attempt just once in the first eight weeks of the season, he’s done so in each of his last three games. Still, he’s PFF’s 28th highest-graded passer this season.
Goff on the other hand is in the midst of a career year, ranking top-10 in the NFL in per-drive and per-game efficiency this season. He has PFF’s fifth-highest passing grade this season and has the Lions averaging the third-most offensive touchdowns per game over the last three weeks.
Green Bay is exactly average in turning drives into points, and when observing team defensive metrics, is facing a far tougher defense, as the Lions rank top 12 in pass defense DVOA. But schedule-adjusted fantasy points (aFPA) tell a different story, as the Lions quietly give up the sixth-highest aFPA to quarterbacks in the NFL. Love may have to use his legs, as Justin Fields did in Week 11 if he wants to rack up yardage against this suddenly tough Detroit defense.
Core Plays and Auxiliary Options

- DFS & Season-Long Content
- Lineup Generator
- Optimal Cash & GPP Lineups
- Floor & Ceiling Projections
- -Leverage Scores
- -...and much much more!


