FFPC Win Rates: Tight Ends

Tight ends are a Ponzi scheme. We get lured in by the elite-options season. The hype train for the middle-class players comes next. Finally, somebody’s ‘sleeper’ pick becomes everyone’s favorite target without fail. It’s a vicious cycle that ends the same way. A subset of the same studs tops the charts with an assortment of mid-tier players. And, at least one guy few saw coming. FFPC makes drafting tight-ends slightly more exciting with the premium scoring, but the position still feels random year to year. Regardless, with some data from the good folks over at FantasyMojo, I’ll walk you through my approach to the position this season.
More Best Ball Content: FFPC Win Rates: QBs | FFPC Win Rates: RBs | Best Ball Mania Positional Allocation Guide | Best Ball Mania Roster Construction Guide | Best Ball Mania Positional Draft Strategies | How to Approach Underdog 3-Team Best Ball Drafts
Highest TE Win Rates
| Rank | Player | Roster Rate on Winning Teams | ADP |
|---|---|---|---|
| 1 | Mark Andrews | 21.2% | 4.05 |
| 2 | Dalton Schultz | 14.1% | 24.01 |
| 3 | Rob Gronkowski | 13.3% | 11.07 |
| 4 | Travis Kelce | 12.2% | 1.03 |
| 5 | Dawson Knox | 12.0% | 20.11 |
| 6 | C.J. Uzomah | 11.8% | 21.08 |
| 7 | Zach Ertz | 10.9% | 14.04 |
| 8 | Jordan Akins | 9.8% | 24.06 |
| 9 | Mike Gesicki | 9.7% | 9.01 |
| 10 | T.J. Hockenson | 9.6% | 4.01 |
| 11 | George Kittle | 8.9% | 2.06 |
| 12 | Hunter Henry | 8.7% | 12.08 |
Again, I’ll use roster win rate to set the stage. Paths to victory weren’t wholly dependent on drafting one of these guys. Well, maybe Mark Andrews. But still, when combined with ADP, we get some idea of where we should be taking our swings.
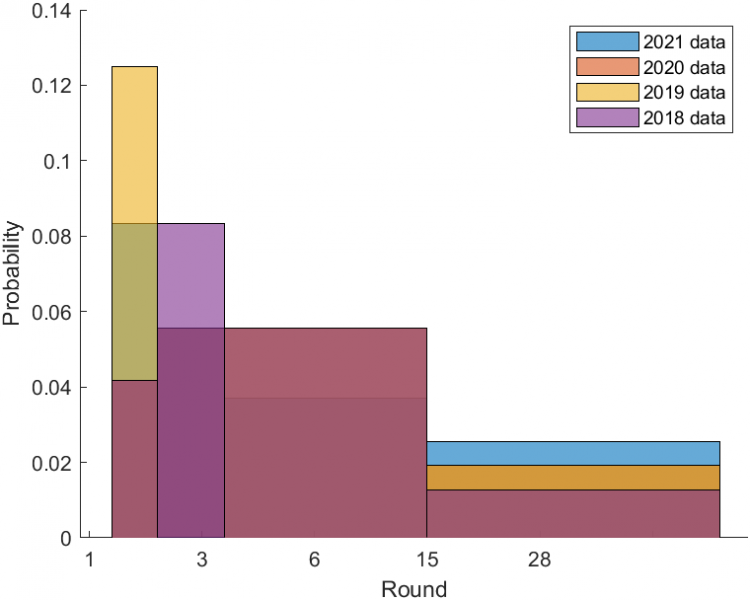
Before your eyes criss-cross looking at the chart, check out the downward trend as more rounds pass. It’s not just one season of the early-round tight-ends dominating the roster win rate Top 12. It’s been four straight years. Of course, there are outliers. Dalton Schultz ascended to the Top 8 in just one year. But, unlike quarterbacks or running backs, our chances of finding steady production drop off as the draft progresses.
We’ve got options, though. I did some quick perusing of our roster construction tool for Underdog Fantasy. it's a different platform with different scoring, but I wanted proof of concept. Teams with a tight-end drafted before the fourth round averaged 1,515 points. However, drafters that waited until Rounds 5 or 6 outscored them. So, let’s break down the production profiles during each draft phase and see what we should be targeting in 2022.
Early Rounds
| Rank | Player | Roster Rate on Winning Teams | ADP |
|---|---|---|---|
| 1 | Mark Andrews | 21.2% | 4.5 |
| 4 | Travis Kelce | 12.2% | 1.3 |
| 10 | T.J. Hockenson | 9.6% | 4.1 |
| 11 | George Kittle | 8.9% | 2.6 |
We know what to expect in the early rounds for tight-ends. Early-down, red-zone, and intermediate or deep targets are all up for grabs here. Opportunity brings us back to the elite options, as it has one of the strongest correlations with a player’s fantasy rank.
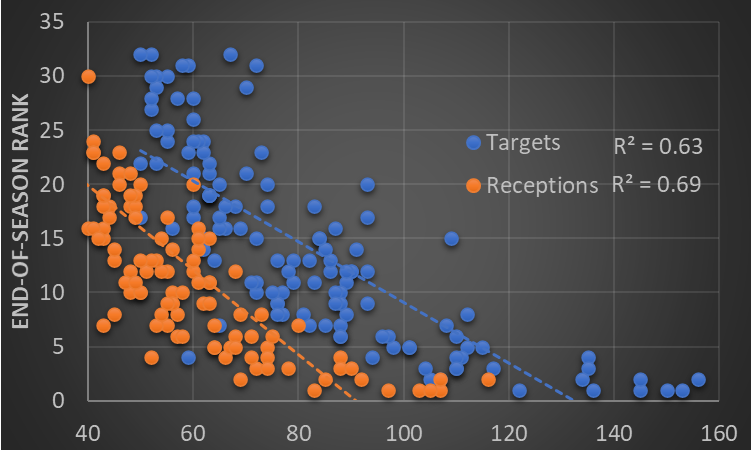
It seems straightforward that targets and receptions are crucial to their success. But remember tight-ends play two positions. So, their opportunity must translate into fantasy production to sustain their value. For the early-rounders, it’s an easy task.
| Name | TE1 | Top 3 | Top 6 | Top 12 | PPR PPG |
|---|---|---|---|---|---|
| Mark Andrews | 2 | 6 | 11 | 12 | 17.7 |
| Travis Kelce | 3 | 6 | 10 | 12 | 16.4 |
| T.J. Hockenson | 1 | 3 | 4 | 7 | 12.1 |
| George Kittle | 2 | 3 | 6 | 8 | 14.1 |
The ‘top-12 option with first overall upside’ profile is too much to ignore here. Early-round tight-ends were running routes on 83.4% of their quarterback’s dropbacks. The smallest target share of the four was 21.8%. Their ability to outearn their peers and other pass-catchers on the same team makes them unicorns at the position. And it’s not like 2021 was a fluke.
| Season | Player | TE1 | Top 3 | Top 6 | Top 12 |
|---|---|---|---|---|---|
| 2020 | Darren Waller | 3 | 6 | 11 | 11 |
| 2020 | Mark Andrews | 1 | 5 | 6 | 8 |
| 2020 | Travis Kelce | 6 | 9 | 14 | 15 |
| 2019 | George Kittle | 2 | 5 | 8 | 12 |
| 2019 | Travis Kelce | 1 | 4 | 8 | 14 |
| 2019 | Zach Ertz | 3 | 5 | 7 | 9 |
| 2018 | Travis Kelce | 5 | 7 | 10 | 13 |
| 2018 | Trey Burton | 1 | 2 | 3 | 8 |
| 2018 | Zach Ertz | 3 | 9 | 9 | 12 |
Premium scoring on FFPC may force your hand, but drafting at least one early-round target is the optimal approach. They’ve maintained a 43.8% hit rate for the Top 12 over the last four seasons, and we’re drafting the same amount this season (eight). A hit here would solidify your squad throughout most of the season with your other tight-ends on hand to pick up the slack if needed.
Favorite Early-Round Targets: Mark Andrews (1.12), Kyle Pitts (2.05), Darren Waller (2.12), Dalton Schultz (4.02)
Middle Rounds
| Rank | Player | Roster Rate on Winning Teams | ADP |
|---|---|---|---|
| 3 | Rob Gronkowski | 13.3% | 11.7 |
| 7 | Zach Ertz | 10.9% | 14.4 |
| 9 | Mike Gesicki | 9.7% | 9.1 |
| 12 | Hunter Henry | 8.7% | 12.8 |
Optimal roster constructions call for three or four tight-ends. So, you’ll need to add more throughout the middle rounds. Some of the names aren’t as appealing, but there’s some upside to them. It seems like an easy task just grabbing a guy or two, but the middle rounds are a race to fortify other positions.
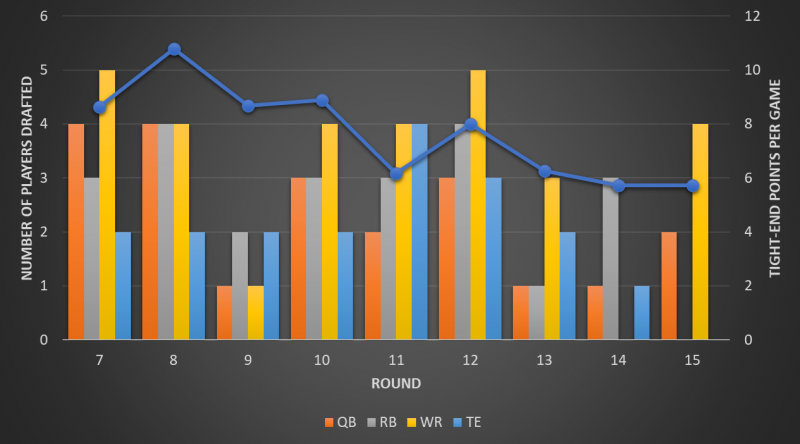
Here’s another way to visualize opportunity cost. I used just 2021 ADP, but you can see how many other positions are flying off the board. We draft more quarterbacks, running backs, and wide receivers in five of nine rounds. At best, it’s a push in a few rounds. Meanwhile, the average points per game for tight-ends continue to fall. We need to bolster our early-round investments so let’s look at what’s needed production-wise.
| Player | TE1 | Top 3 | Top 6 | Top 12 |
|---|---|---|---|---|
| Mike Gesicki | 0 | 3 | 3 | 6 |
| Rob Gronkowski | 1 | 6 | 6 | 8 |
| Hunter Henry | 0 | 2 | 3 | 5 |
| Zach Ertz | 1 | 1 | 3 | 10 |
Rob Gronkowski’s the gold standard given his offense and quarterback. But Mike Gesicki’s situation was on the opposite end of the spectrum. And still, he was able to cobble together multiple top-3 and top-6 weeks. Their overall target shares ranged from 14.7% to 21.4%, but they made up for it in the red zone.
| Player | Red-zone Target Share |
|---|---|
| Mike Gesicki | 14.5% |
| Rob Gronkowski | 15.2% |
| Hunter Henry | 23.6% |
| Zach Ertz | 23.9% |
Zach Ertz and Hunter Henry made the Top 10 in red-zone targets for all tight-ends. Ertz’s trade sustained his fantasy upside, but he had a 20.0% red-zone share while still in Philadelphia. Regardless, we can see what to value in the middle rounds. Our targets should be players that are the second or third passing option that’s still on the field when inside the 20-yard line. They won’t constantly top the charts, but multiple shots at the Top 6 are what we need.
Favorite Mid-Round Targets: Rob Gronkowski (9.08), Tyler Higbee (10.10), Logan Thomas (12.02), Hayden Hurst (13.04)
Late Rounds
| Rank | Player | Roster Rate on Winning Teams | ADP |
|---|---|---|---|
| 2 | Dalton Schultz | 14.1% | 24.1 |
| 5 | Dawson Knox | 12.0% | 20.11 |
| 6 | C.J. Uzomah | 11.8% | 21.8 |
| 8 | Jordan Akins | 9.8% | 24.6 |
We say darts, but I’d like to think of the late-round options as ‘educated guesses.’ We won’t always be correct, but finding a viable process can yield positive results. So let’s derive a method from this madness.
| Player | 2020 Target Share | 2021 Target Share | 2020 RZ Target Share | 2021 RZ Target Share |
|---|---|---|---|---|
| Dawson Knox | 9.3% | 11.10% | 14.3% | 15.8% |
| C.J. Uzomah | 10.3% | 11.90% | 13.3% | 11.7% |
| Dalton Schultz | 14.0% | 16.50% | 17.1% | 12.4% |
| Jordan Akins | 10.4% | 8.00% | 11.4% | 11.6% |
After looking at this chart, I completely whiffed on Dalton Schultz. But the larger point is these guys weren’t hiding in the shadows. And actually, this point holds for the prior three seasons, too.
| Season | Player | Previous Year's Target Share |
|---|---|---|
| 2020 | Jimmy Graham | 10.5% |
| 2020 | Darren Fells | 10.4% |
| 2019 | Will Dissly | 11.6% |
| 2019 | Gerald Everett | 8.9% |
| 2018 | Jesse James | 10.7% |
Rookies and players set to benefit from ‘vacated targets’ typically take center stage in the later rounds. But, like crowded backfields for running backs, we tend to overprice the uncertainty that comes with it. And it pushes down the prices for potential stars.
| Player | TE1 | Top 3 | Top 6 | Top 12 |
|---|---|---|---|---|
| Dawson Knox | 0 | 3 | 5 | 7 |
| C.J. Uzomah | 2 | 2 | 2 | 3 |
| Dalton Schultz | 1 | 3 | 6 | 11 |
| Jordan Akins | 0 | 0 | 0 | 1 |
Jordan Akins sets the bar low for late-rounders, but we can see how the others vaulted into the upper ranks. Each was part of multi-option passing games with top-12 quarterbacks. The same was the case for the others in past seasons. As a result, we can use this approach when evaluating tight-ends once the other positions thin out.
Favorite Late-Round Targets: Mo Alie-Cox (18.09), Ricky Seals-Jones (22.03)
Bottom Line
- Leaving Rounds 1-6 with at least one tight-end is an optimal approach to drafting. Early-round tight-ends have dominated the roster win rate Top 12 for four straight years.
- Tight-ends drafted before Round 6 have maintained a 43.8% hit rate for the Top 12 over the last four seasons. The previous season’s elite options ran routes on 83.4% of their quarterback’s dropbacks, and 21.8% was the smallest target share.
- Mid-round targets should be second or third passing options with red-zone opportunities. Tight-ends drafted here had target shares ranging from 14.7% to 21.4% but had an average red-zone target share of 19.3%.
- Late-round targets aren’t a secret. They’ve had an average 10.7% target share the previous season.
- Eight of the last nine late-round tight-ends were a part of diverse passing offenses attached to top-12 quarterbacks. The uncertainty drives their price down creating value in the late rounds.


