Week 9 DraftKings & FanDuel Winning GPP Lineup Review

In this space each week, I will review the winning lineups from the DraftKings Millionaire Maker and the FanDuel Sunday Million. Analyzing top lineups can help to tease out lineup-building strategies and offer clues on how you could have landed on a similar team.
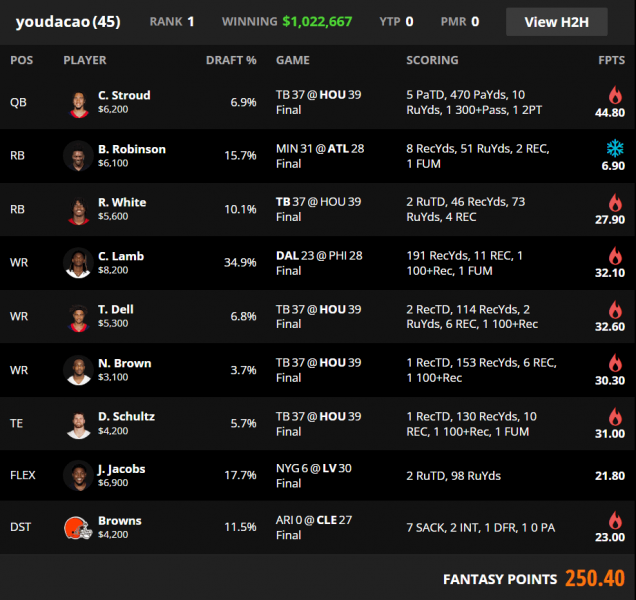
DraftKings Week 9 Millionaire Winning Lineup

Ownership
| Week | QB | RB1 | RB2 | WR1 | WR2 | WR3 | TE | Flex | Flex Pos | DEF | Cumulative |
|---|---|---|---|---|---|---|---|---|---|---|---|
| 1 | 5.8% | 15.1% | 9.7% | 23.6% | 16.9% | 5.7% | 3.7% | 2.2% | WR | 35.5% | 118.2% |
| 2 | 3.3% | 15.8% | 9.5% | 11.7% | 11.0% | 6.1% | 5.0% | 8.4% | RB | 9.8% | 80.6% |
| 3 | 3.7% | 20.4% | 16.2% | 22.8% | 20.6% | 15.7% | 9.3% | 11.0% | WR | 12.3% | 132.0% |
| 4 | 6.1% | 24.4% | 3.3% | 29.3% | 12.6% | 6.7% | 14.7% | 0.3% | WR | 6.2% | 103.6% |
| 5 | 6.2% | 44.6% | 31.2% | 20.0% | 15.8% | 4.3% | 5.6% | 31.1% | RB | 8.5% | 167.3% |
| 6 | 4.2% | 54.8% | 18.9% | 19.7% | 10.8% | 4.6% | 9.3% | 1.3% | WR | 3.4% | 127.0% |
| 7 | 11.6% | 15.5% | 10.3% | 12.4% | 4.4% | 2.3% | 19.8% | 17.9% | TE | 12.8% | 107.0% |
| 8 | 6.4% | 45.1% | 29.7% | 27.1% | 7.8% | 5.4% | 19.5% | 0.9% | WR | 8.6% | 150.5% |
| 9 | 6.9% | 17.7% | 15.7% | 34.9% | 6.8% | 3.7% | 5.7% | 10.1% | RB | 11.5% | 113.0% |
| AVG | 6.0% | 28.2% | 16.1% | 22.4% | 11.9% | 6.1% | 10.3% | 9.2% | 12.1% | 122.1% | |
| 2022 AVG | 9.7% | 22.2% | 11.2% | 20.3% | 12.6% | 8.3% | 8.5% | 6.1% | 9.9% | 108.7% | |
| 2021 AVG | 7.6% | 19.7% | 9.5% | 17.8% | 11.8% | 7.6% | 10.0% | 4.4% | 7.1% | 95.3% | |
| 2020 AVG | 9.1% | 24.0% | 9.8% | 18.0% | 13.5% | 8.7% | 8.8% | 4.2% | 10.9% | 106.9% | |
| 2019 AVG | 7.8% | 26.7% | 14.5% | 19.7% | 10.3% | 6.6% | 12.6% | 7.9% | 11.1% | 117.4% |
Stacks
| Week | Primary Stack | Secondary Stack | Third Stack | Correlated Players |
|---|---|---|---|---|
| 1 | QB/WR/Opp RB | 3 | ||
| 2 | QB/RB/TE | RB/DEF | RB/Opp WR | 7 |
| 3 | QB/TE | RB/WR | 4 | |
| 4 | QB/WR | RB/Opp WR | WR/Opp TE | 6 |
| 5 | QB/WR | RB/DEF | RB/Opp WR | 6 |
| 6 | QB/WR/TE | RB/WR | 5 | |
| 7 | QB/TE | RB/Opp TE | 4 | |
| 8 | QB/WR/WR | 3 | ||
| 9 | QB/WR/WR/TE/Opp RB | 5 |
Going back to Week 1 of 2020, this was only the fourth Millionaire winner to stack at least five players from the same game or four players from the same team.
Flex
This was the highest rate that the field used three running backs all season with 40% of lineups flexing a running back. Top-1% lineups had nearly identical flex rates to the field, with 38% of top lineups using three running backs. Tight end was used in the flex 12% of the time, both overall and for top-1% lineups.
Leverage/Unique Builds
Only four wide receivers were in more lineups than Nico Collins (19%), making pivots to his teammates in the passing game strong leverage plays. Heavily stacking one game made sense on a slate with only 10 games and no total above 46.5—if a game hit big, it had a good chance to lap the field.
Tank Dell was a price pivot off of Terry McLaurin ($5,600, 18% ownership; Noah Brown was a contrarian punt option off of Demario Douglas ($4,000, 30%); Dalton Schultz was priced near Jake Ferguson ($4,000, 11%) and Kyle Pitts ($4,100, 11%).
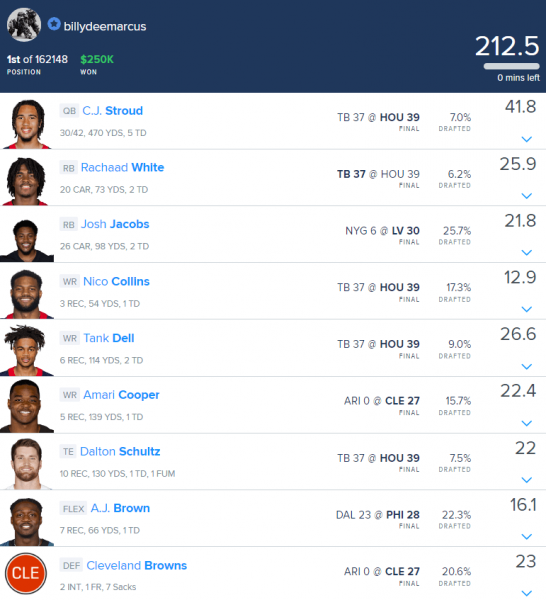
FanDuel Week 9 Sunday Million Winning Lineup

Ownership
| Week | QB | RB1 | RB2 | WR1 | WR2 | WR3 | TE | Flex | Flex Pos | DEF | Cumulative |
|---|---|---|---|---|---|---|---|---|---|---|---|
| 1 | 4.3% | 20.2% | 14.9% | 23.3% | 20.0% | 4.0% | 10.9% | 0.6% | WR | 1.2% | 99.4% |
| 2 | 2.2% | 13.1% | 10.8% | 11.3% | 10.7% | 7.1% | 6.4% | 3.3% | RB | 30.5% | 95.4% |
| 3 | 26.4% | 29.7% | 17.4% | 10.7% | 8.7% | 8.2% | 14.0% | 13.6% | RB | 4.1% | 132.8% |
| 4 | 10.0% | 27.1% | 4.2% | 10.3% | 8.0% | 1.2% | 5.4% | 2.2% | RB | 5.5% | 73.9% |
| 5 | 6.7% | 29.8% | 14.5% | 13.9% | 12.3% | 10.3% | 26.7% | 6.7% | TE | 8.7% | 129.6% |
| 6 | 11.3% | 28.8% | 20.6% | 25.6% | 11.7% | 9.4% | 2.6% | 14.7% | RB | 10.1% | 134.8% |
| 7 | 13.8% | 29.8% | 18.0% | 12.2% | 6.2% | 4.0% | 22.8% | 7.8% | RB | 4.4% | 119.0% |
| 8 | 6.3% | 18.7% | 9.4% | 17.3% | 8.6% | 7.1% | 16.0% | 4.7% | RB | 3.4% | 91.5% |
| 9 | 7.0% | 25.7% | 6.2% | 22.3% | 17.3% | 15.7% | 7.5% | 9.0% | WR | 20.6% | 131.3% |
| AVG | 9.8% | 24.8% | 12.9% | 16.3% | 11.5% | 7.4% | 12.5% | 7.0% | 9.8% | 112.0% | |
| 2022 AVG | 10.0% | 25.9% | 14.0% | 17.7% | 11.0% | 6.6% | 8.1% | 7.2% | 7.0% | 107.4% | |
| 2021 AVG | 11.2% | 28.5% | 12.8% | 24.0% | 13.8% | 8.1% | 12.8% | 4.9% | 7.7% | 123.8% | |
| 2020 AVG | 11.1% | 25.5% | 14.0% | 22.4% | 14.0% | 9.0% | 9.1% | 8.0% | 9.4% | 122.3% | |
| 2019 AVG | 8.3% | 21.4% | 9.7% | 18.2% | 11.4% | 7.5% | 14.8% | 5.1% | 5.7% | 102.2% |
Stacks
| Week | Primary Stack | Secondary Stack | Third Stack | Fourth Stack | Correlated Players |
|---|---|---|---|---|---|
| 1 | 0 | ||||
| 2 | QB/TE | RB/DEF | 4 | ||
| 3 | QB/Opp WR | RB/Opp WR | RB/Opp WR | 6 | |
| 4 | QB/WR/TE | RB/Opp WR | 5 | ||
| 5 | QB/WR | RB/DEF | WR/Opp TE | WR/Opp TE | 8 |
| 6 | QB/RB/Opp RB/Opp WR | RB/Opp WR | 6 | ||
| 7 | QB/Opp RB/Opp WR | RB/DEF | WR/Opp TE | 7 | |
| 8 | QB/WR | RB/DEF | 4 | ||
| 9 | QB/WR/WR/TE/Opp RB | WR/DEF | 7 |
Only one other Sunday Million winner since the start of 2022 has stacked five players from the same game or four from the same team.
Leverage/Unique Builds
Rachaad White was priced near Tony Pollard, who ended up in nearly three times as many lineups.
Dalton Schultz had a similar salary to Dallas Goedert and Jake Ferguson, who both projected for double-digit ownership.


