Week 1 DraftKings & FanDuel Winning GPP Lineup Review

In this space each week, I will review the winning lineups from the DraftKings Millionaire Maker and the FanDuel Sunday Million. Analyzing top lineups can help to tease out lineup-building strategies and offer clues on how you could have landed on a similar team.
Two of the most important elements to understand when building GPP lineups are ownership and stacking so before jumping into Week 1 winning lineups, here’s a review of how 2022 winners build around these concepts.
Ownership and Stacks in 2022 Winning DraftKings Lineups
| Week | QB | RB1 | RB2 | WR1 | WR2 | WR3 | TE | Flex | Flex Pos | DEF | Cumulative |
|---|---|---|---|---|---|---|---|---|---|---|---|
| 1 | 9.1% | 14.2% | 9.3% | 27.1% | 12.5% | 11.2% | 17.2% | 7.9% | WR | 3.0% | 111.5% |
| 2 | 3.6% | 10.4% | 8.4% | 21.3% | 19.7% | 14.4% | 9.2% | 6.3% | WR | 1.8% | 95.1% |
| 3 | 2.3% | 16.0% | 13.9% | 16.9% | 8.8% | 5.6% | 2.6% | 1.4% | WR | 15.7% | 83.2% |
| 4 | 6.8% | 38.0% | 15.2% | 15.4% | 11.4% | 5.7% | 19.8% | 6.1% | RB | 3.3% | 121.7% |
| 5 | 12.1% | 14.1% | 13.9% | 27.0% | 13.4% | 7.5% | 7.8% | 9.6% | RB | 22.7% | 128.1% |
| 6 | 4.4% | 12.7% | 8.5% | 14.7% | 4.9% | 3.2% | 2.6% | 2.4% | WR | 0.6% | 54.0% |
| 7 | 17.0% | 46.7% | 32.1% | 15.4% | 2.6% | 2.1% | 8.1% | 21.4% | RB | 43.8% | 189.2% |
| 8 | 21.1% | 50.9% | 12.5% | 27.6% | 28.8% | 26.4% | 1.6% | 7.4% | WR | 0.9% | 177.2% |
| 9 | 14.2% | 40.5% | 13.6% | 14.9% | 10.0% | 8.5% | 1.4% | 12.2% | RB | 10.2% | 125.5% |
| 10 | 29.4% | 25.8% | 10.6% | 20.4% | 16.9% | 10.3% | 16.0% | 2.4% | WR | 16.0% | 147.8% |
| 11 | 0.6% | 13.4% | 11.3% | 14.1% | 4.6% | 3.7% | 5.4% | 5.6% | RB | 6.6% | 65.3% |
| 12 | 7.0% | 10.4% | 3.5% | 14.8% | 13.1% | 8.8% | 17.4% | 4.5% | WR | 24.2% | 103.7% |
| 13 | 1.9% | 14.9% | 7.7% | 33.9% | 27.7% | 10.1% | 1.5% | 5.1% | WR | 4.0% | 106.8% |
| 14 | 2.5% | 21.3% | 7.4% | 27.1% | 11.3% | 6.0% | 3.6% | 2.0% | RB | 6.6% | 87.8% |
| 15 | 9.7% | 11.0% | 0.3% | 18.6% | 8.6% | 8.6% | 15.8% | 3.1% | WR | 4.3% | 80.0% |
| 16 | 11.8% | 9.6% | 1.2% | 24.1% | 18.6% | 9.6% | 13.8% | 9.3% | WR | 4.9% | 102.9% |
| 17 | 3.2% | 25.5% | 16.0% | 10.7% | 7.4% | 6.4% | 2.0% | 1.1% | TE | 4.9% | 77.2% |
| 18 | 17.0% | 24.3% | 15.4% | 21.9% | 6.1% | 1.7% | 7.2% | 1.2% | WR | 4.7% | 99.5% |
| AVG | 9.2% | 22.1% | 10.9% | 20.2% | 13.0% | 8.7% | 8.6% | 6.3% | 10.2% | 108.7% |
| Week | Primary Stack | Secondary Stack | Third Stack | Correlated Players |
|---|---|---|---|---|
| 1 | QB/TE | RB/Opp WR | WR/Opp WR | 6 |
| 2 | QB/WR/WR/Opp TE | 4 | ||
| 3 | QB/TE | RB/Opp WR | 4 | |
| 4 | QB/WR/WR/Opp RB/Opp WR/Opp TE | 6 | ||
| 5 | QB/WR | RB/WR/TE | WR/Opp WR | 7 |
| 6 | QB/WR/Opp RB | 3 | ||
| 7 | QB/WR/TE | RB/Opp RB | 5 | |
| 8 | QB/WR/WR | RB/DEF | WR/TE | 7 |
| 9 | QB/WR/TE/Opp WR | RB/DEF | 6 | |
| 10 | QB/Opp WR | RB/Opp WR | TE/Opp WR | 6 |
| 11 | QB/WR/Opp RB | 3 | ||
| 12 | QB/RB | WR/Opp TE | WR/DEF | 6 |
| 13 | QB/WR | RB/TE | RB/WR | 6 |
| 14 | QB/WR/TE/Opp RB | WR/Opp RB | 6 | |
| 15 | QB/RB/WR/TE | RB/Opp WR | 6 | |
| 16 | QB/RB/WR/WR/Opp WR/Opp TE | 6 | ||
| 17 | QB/WR/WR/Opp WR | RB/Opp TE | 6 | |
| 18 | QB/WR/Opp TE | RB/DEF | WR/Opp WR | 7 |
Ownership and Stacks in 2022 Winning FanDuel Lineups
| Week | QB | RB1 | RB2 | WR1 | WR2 | WR3 | TE | Flex | Flex Pos | DEF | Cumulative |
|---|---|---|---|---|---|---|---|---|---|---|---|
| 1 | 9.9% | 17.7% | 9.1% | 17.4% | 12.6% | 6.2% | 14.5% | 1.2% | RB | 2.8% | 91.4% |
| 2 | 3.0% | 7.9% | 2.8% | 9.9% | 6.4% | 5.9% | 8.7% | 0.5% | WR | 4.6% | 49.7% |
| 3 | 4.4% | 15.0% | 5.0% | 15.6% | 5.6% | 4.2% | 4.1% | 1.9% | RB | 6.6% | 62.4% |
| 4 | 2.2% | 31.2% | 12.8% | 11.7% | 7.6% | 7.6% | 20.1% | 3.9% | RB | 4.8% | 101.9% |
| 5 | 17.8% | 17.4% | 13.0% | 22.7% | 14.7% | 0.9% | 3.8% | 6.3% | RB | 4.6% | 101.2% |
| 6 | 4.2% | 29.8% | 2.9% | 13.7% | 4.3% | 4.0% | 0.4% | 0.7% | WR | 8.0% | 68.0% |
| 7 | 16.2% | 25.1% | 22.6% | 17.5% | 5.4% | 4.0% | 11.3% | 16.0% | RB | 2.9% | 121.0% |
| 8 | 22.7% | 61.6% | 14.9% | 25.7% | 23.0% | 10.3% | 7.7% | 14.3% | RB | 17.0% | 197.2% |
| 9 | 7.2% | 31.1% | 8.8% | 16.0% | 12.1% | 4.3% | 1.1% | 6.4% | RB | 11.6% | 98.6% |
| 10 | 21.6% | 26.0% | 10.5% | 24.4% | 17.1% | 6.3% | 13.7% | 5.2% | RB | 12.4% | 137.2% |
| 11 | 24.2% | 15.9% | 4.6% | 19.6% | 4.7% | 3.7% | 7.8% | 1.6% | RB | 10.9% | 93.0% |
| 12 | 11.7% | 15.9% | 12.2% | 12.9% | 8.9% | 4.3% | 14.6% | 2.2% | RB | 12.8% | 95.5% |
| 13 | 8.8% | 15.5% | 3.5% | 24.4% | 15.6% | 15.1% | 8.5% | 0.1% | WR | 4.6% | 96.1% |
| 14 | 18.3% | 11.9% | 1.2% | 22.5% | 17.1% | 13.2% | 3.9% | 11.2% | WR | 4.7% | 104.0% |
| 15 | 20.4% | 15.5% | 12.2% | 15.2% | 14.8% | 14.7% | 6.6% | 8.7% | RB | 5.4% | 113.5% |
| 16 | 16.3% | 11.3% | 9.6% | 7.8% | 6.5% | 5.0% | 18.7% | 6.9% | RB | 5.7% | 87.8% |
| AVG | 13.1% | 21.8% | 9.1% | 17.3% | 11.0% | 6.9% | 9.1% | 5.4% | 7.5% | 101.2% |
| Week | Primary Stack | Secondary Stack | Third Stack | Correlated Players |
|---|---|---|---|---|
| 1 | QB/TE | 2 | ||
| 2 | QB/WR/WR/Opp TE | RB/Opp WR | 6 | |
| 3 | QB/TE | RB/WR/DEF | RB/WR | 7 |
| 4 | QB/RB/WR/TE/Opp WR | RB/WR | 7 | |
| 5 | QB/WR/WR | RB/TE | 5 | |
| 6 | QB/WR | WR/TE | 4 | |
| 7 | QB/WR/WR | 3 | ||
| 8 | RB/WR | WR/Opp WR/Opp TE | 5 | |
| 9 | QB/WR/TE | RB/WR | 5 | |
| 10 | QB/TE | RB/WR | 4 | |
| 11 | RB/WR/Opp RB | WR/Opp TE | 5 | |
| 12 | QB/RB/TE | WR/WR | 5 | |
| 13 | QB/WR | RB/DEF | WR/TE | 6 |
| 14 | QB/WR/Opp WR | 3 | ||
| 15 | QB/WR/Opp RB | 3 | ||
| 16 | QB/WR/WR/Opp WR | 4 |
DraftKings Week 1 Millionaire Winning Lineup

Ownership
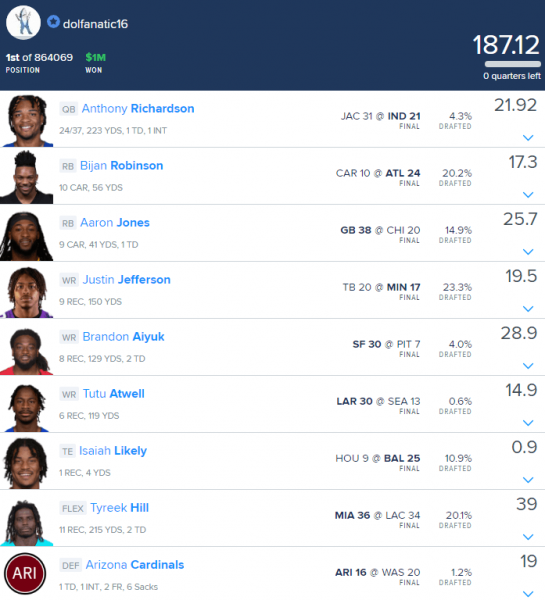
Cumulative ownership of the winning lineup was 118.2%. Average cumulative ownership of winning Millionaire lineups in 2022 was 108.7% and over the last three years, the average is 106.8%. Of all winning Millionaire lineups last year, six had a higher cumulative ownership.
Stacks
The winning lineup used a QB/WR/Opp. RB stack with no secondary stack. It was just the seventh time since Week 1 of 2020 that the Millionaire winner had three or fewer correlated players. Of the last 54 winners, this was just the 13th to have no mini-correlations.
Flex
The field used a running back in the flex 29% of the time, wide receiver 61%, and tight end 10%. Top-1% lineups flexed running backs in 18% of lineups, wide receivers in 76%, and tight ends in 6%.
Leverage
This lineup benefited from price pivots. Kendrick Bourne dominated while Marvin Mims—who projected for double-digit ownership—did next to nothing. Hayden Hurst was the same salary as mega-chalk Isaiah Likely, who scored 1.4 DK points.
FanDuel Week 1 Sunday Million Winning Lineup

Ownership
Cumulative ownership in the winning Sunday Million lineup was 99.4%. The average from 2022 winners was 101.1% and 113.9% from 2020–2022.
Stacks
There were no correlated players in the Week 1 winning lineup. Since Week 1 of 2020, this is just the second Sunday Million winner with no correlation.
Flex
Of the 16 weeks tracked in 2022, only four winners flexed a wide receiver, like the Week 1 winner did. In the previous three years, 35% of winners used a wide receiver with 62% rostering three running backs. Only two of the 68 winners recorded from the last three years used a tight end in the flex.


