Week 7 DraftKings & FanDuel Winning GPP Lineup Review

In this space each week, I will review the winning lineups from the DraftKings Millionaire Maker and the FanDuel Sunday Million. Analyzing top lineups can help to tease out lineup-building strategies and offer clues on how you could have landed on a similar team.
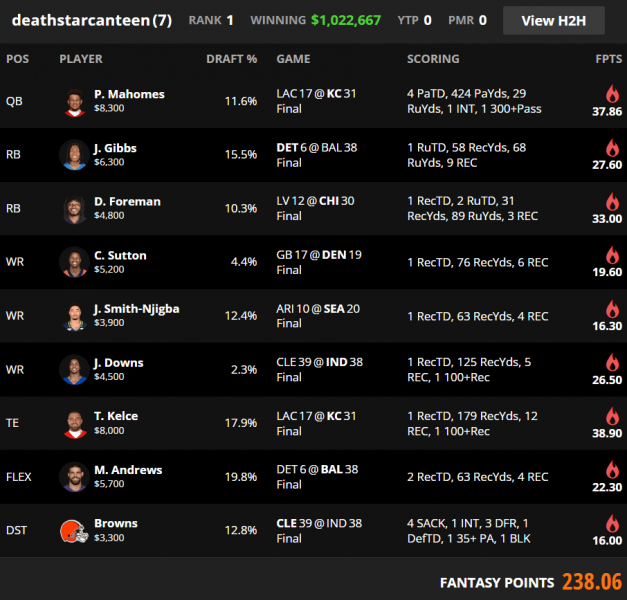
DraftKings Week 7 Millionaire Winning Lineup

Ownership
| Week | QB | RB1 | RB2 | WR1 | WR2 | WR3 | TE | Flex | Flex Pos | DEF | Cumulative |
|---|---|---|---|---|---|---|---|---|---|---|---|
| 1 | 5.8% | 15.1% | 9.7% | 23.6% | 16.9% | 5.7% | 3.7% | 2.2% | WR | 35.5% | 118.2% |
| 2 | 3.3% | 15.8% | 9.5% | 11.7% | 11.0% | 6.1% | 5.0% | 8.4% | RB | 9.8% | 80.6% |
| 3 | 3.7% | 20.4% | 16.2% | 22.8% | 20.6% | 15.7% | 9.3% | 11.0% | WR | 12.3% | 132.0% |
| 4 | 6.1% | 24.4% | 3.3% | 29.3% | 12.6% | 6.7% | 14.7% | 30.0% | WR | 6.2% | 133.3% |
| 5 | 6.2% | 44.6% | 31.2% | 20.0% | 15.8% | 4.3% | 5.6% | 31.1% | RB | 8.5% | 167.3% |
| 6 | 4.2% | 54.8% | 18.9% | 19.7% | 10.8% | 4.6% | 9.3% | 1.3% | WR | 3.4% | 127.0% |
| 7 | 11.6% | 15.5% | 10.3% | 12.4% | 4.4% | 2.3% | 19.8% | 17.9% | TE | 12.8% | 107.0% |
| AVG | 5.8% | 27.2% | 14.2% | 19.9% | 13.2% | 6.5% | 9.6% | 14.6% | 12.6% | 123.6% | |
| 2022 AVG | 9.7% | 22.2% | 11.2% | 20.3% | 12.6% | 8.3% | 8.5% | 6.1% | 9.9% | 108.7% | |
| 2021 AVG | 7.6% | 19.7% | 9.5% | 17.8% | 11.8% | 7.6% | 10.0% | 4.4% | 7.1% | 95.3% | |
| 2020 AVG | 9.1% | 24.0% | 9.8% | 18.0% | 13.5% | 8.7% | 8.8% | 4.2% | 10.9% | 106.9% | |
| 2019 AVG | 7.8% | 26.7% | 14.5% | 19.7% | 10.3% | 6.6% | 12.6% | 7.9% | 11.1% | 117.4% |
Stacks
| Week | Primary Stack | Secondary Stack | Third Stack | Correlated Players |
|---|---|---|---|---|
| 1 | QB/WR/Opp RB | 3 | ||
| 2 | QB/RB/TE | RB/DEF | RB/Opp WR | 7 |
| 3 | QB/TE | RB/WR | 4 | |
| 4 | QB/WR | RB/Opp WR | WR/Opp TE | 6 |
| 5 | QB/WR | RB/DEF | RB/Opp WR | 6 |
| 6 | QB/WR/TE | RB/WR | 5 | |
| 7 | QB/TE | RB/Opp TE | 4 |
Flex
For the first time this season, top-1% lineups used a tight end in the flex at a higher rate than the field, doing so at a 32% rate, compared to 17% by the field—that 17% tied a season-high rate.
This was the seventh winner since Week 1 of 2019 to roster two tight ends.
Leverage/Unique Builds
The winning lineup had no wide receivers priced above $5,200—that made it only the second Millionaire winner since the start of 2019 with no wide receivers at $6,000 or above.
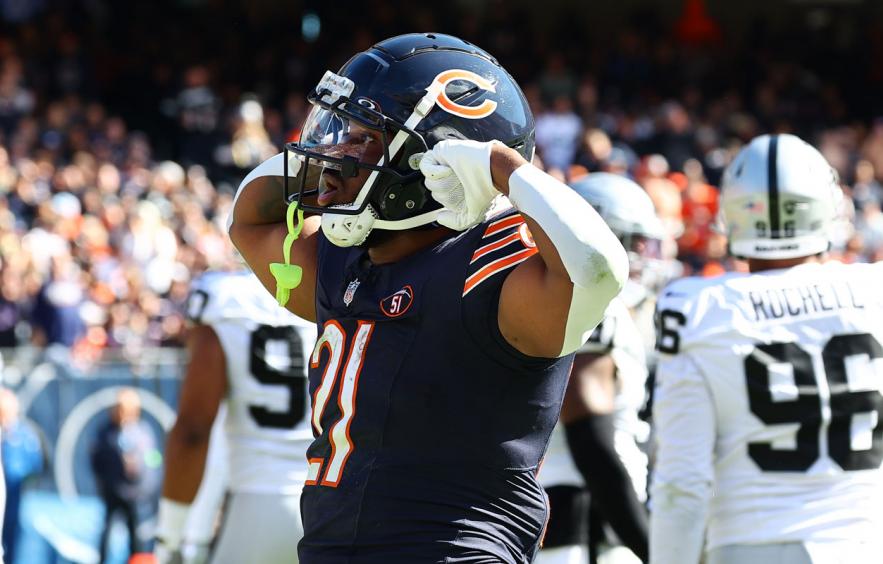
Although D'Onta Foreman was in 10% of lineups, he was a low-salary running back pivot off of Jerome Ford, who was in 23% of lineups. Josh Downs also offered same-game leverage off of Ford in case there was a shootout, which there was.
Cortland Sutton was a low-owned player in a game that had three players in the passing game at 14% or higher on the other side of the ball.
FanDuel Week 7 Sunday Million Winning Lineup

Ownership
| Week | QB | RB1 | RB2 | WR1 | WR2 | WR3 | TE | Flex | Flex Pos | DEF | Cumulative |
|---|---|---|---|---|---|---|---|---|---|---|---|
| 1 | 4.3% | 20.2% | 14.9% | 23.3% | 20.0% | 4.0% | 10.9% | 0.6% | WR | 1.2% | 99.4% |
| 2 | 2.2% | 13.1% | 10.8% | 11.3% | 10.7% | 7.1% | 6.4% | 3.3% | RB | 30.5% | 95.4% |
| 3 | 26.4% | 29.7% | 17.4% | 10.7% | 8.7% | 8.2% | 14.0% | 13.6% | RB | 4.1% | 132.8% |
| 4 | 10.0% | 27.1% | 4.2% | 10.3% | 8.0% | 1.2% | 5.4% | 2.2% | RB | 5.5% | 73.9% |
| 5 | 6.7% | 29.8% | 14.5% | 13.9% | 12.3% | 10.3% | 26.7% | 6.7% | TE | 8.7% | 129.6% |
| 6 | 11.3% | 28.8% | 20.6% | 25.6% | 11.7% | 9.4% | 2.6% | 14.7% | RB | 10.1% | 134.8% |
| 7 | 13.8% | 29.8% | 18.0% | 12.2% | 6.2% | 4.0% | 22.8% | 7.8% | RB | 4.4% | 119.0% |
| AVG | 10.7% | 25.5% | 14.3% | 15.3% | 11.1% | 6.3% | 12.7% | 7.0% | 9.2% | 112.1% | |
| 2022 AVG | 11.0% | 24.3% | 9.2% | 20.3% | 12.2% | 7.7% | 10.5% | 5.7% | 6.6% | 107.5% | |
| 2021 AVG | 9.7% | 26.3% | 15.7% | 22.7% | 14.1% | 8.0% | 8.6% | 7.0% | 7.0% | 119.0% | |
| 2020 AVG | 10.1% | 24.3% | 11.8% | 17.9% | 11.5% | 7.2% | 14.9% | 6.0% | 6.9% | 110.7% | |
| 2019 AVG | 9.7% | 26.4% | 13.6% | 21.1% | 12.2% | 8.1% | 11.3% | 6.4% | 9.3% | 118.0% |
Stacks
| Week | Primary Stack | Secondary Stack | Third Stack | Fourth Stack | Correlated Players |
|---|---|---|---|---|---|
| 1 | 0 | ||||
| 2 | QB/TE | RB/DEF | 4 | ||
| 3 | QB/Opp WR | RB/Opp WR | RB/Opp WR | 6 | |
| 4 | QB/WR/TE | RB/Opp WR | 5 | ||
| 5 | QB/WR | RB/DEF | WR/Opp TE | WR/Opp TE | 8 |
| 6 | QB/RB/Opp RB/Opp WR | RB/Opp WR | 6 | ||
| 7 | QB/Opp RB/Opp WR | RB/DEF | WR/Opp TE | 7 |
Leverage/Unique Builds
Joshua Palmer was a great example of understanding value across sites and how that impacts ownership. While Palmer was a top-10 wide receiver on DraftKings, in terms of ownership, he had single-digit ownership in the FanDuel Sunday Million.
Along with Foreman coming off a bad game in Week 6, pairing him with his defense added low-owned upside in the event that Foreman ended up in a positive game script.
No wide receiver priced below $6,300 was projected for double-digit ownership, making Kendrick Bourne part of a unique build opposite a popular Stefon Diggs.


