A DFS Value Metric To Remedy the Flaws of Points Per Dollar

On the surface, basing DFS decisions off points per dollar makes sense. After all, your aim is to score more points per dollar than your opponents. But as sturdy as the concept of points per dollar is in theory on a macro level, it can often break down in practice on a micro level.
Here are the two main issues with using points per dollar to determine/compare player value:
-
The higher a player’s salary, the fewer points per dollar he needs to be valuable, and vice-versa. If two players are projected for the same amount of points per dollar but have different salaries, they are not equally valuable.
-
Every position averages a different amount of points per dollar. If two players are projected for the same amount of points per dollar but play different positions, they are not equally valuable.
That's why we've devised a Value metric for comparing player values in DFS that 4for4 relies on.
The metric, which we will refer to simply as "Value," uses multi-year historical data to determine a player's scoring expectation based on two things: (1) salary and (2) position. That scoring expectation is then subtracted from a player's projected points to arrive at his Value, or his projected points above/below expectation.
Let's go through two examples—one comparing players at the same position with different salaries, and one comparing players at different positions—and show how using the new Value metric is superior to points per dollar and how it will give you an edge.
1. Using the New Value Metric to Better Compare Players at the Same Position
Saquon Barkley and Christian McCaffrey are almost always top plays every week. But on DraftKings, for example, they're usually priced so high that they're never the top projected point per dollar—or, in our case, points per $1,000—plays at their position. For example, despite being projected for the two highest point totals among RBs on DraftKings in Week 1, Barkley and McCaffrey rank just 12th and 14th, respectively, in points per dollar:

Barkley would need 27.8 projected points and McCaffrey would need 27.2 projected points to overtake a player such as Miles Sanders. As good as Barkley and McCaffrey are, projections that high are almost never going to happen.
But that doesn't mean Barkley and McCaffrey aren't better plays than Sanders.
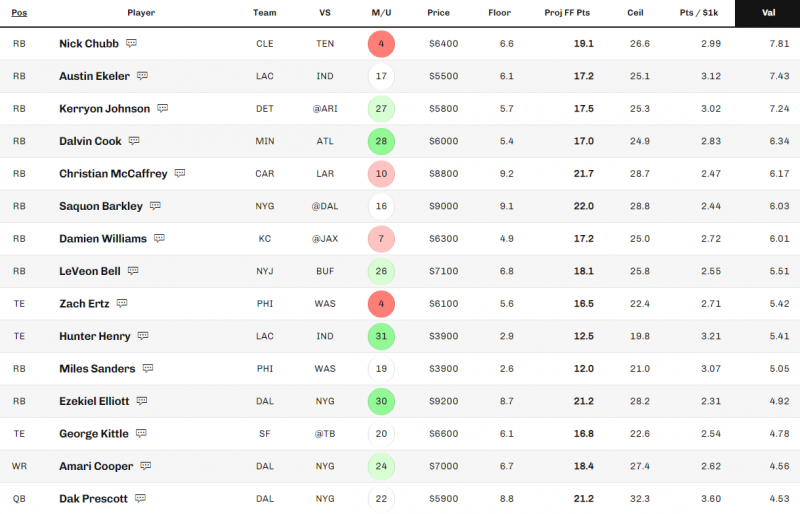
Here's how our Value metric goes to work. Based on multi-year historical data, the Value formula knows that a $3,900 RB scores 6.9 points on average, a $9,000 RB scores 15.9 points on average, and an $8,800 RB scores 15.6 on average. It simply subtracts those baselines from the projected points to calculate each player's value. Now look at the top of the RB rankings:

Points per dollar fails to measure points above/below expectation, which is what we're really looking for most of the time when comparing players. We're trying to maximize total points, not points per dollar. For example, as good as Sanders's points per dollar projection is, nine Miles Sanders would equal only 108 projected points—more than 30 points lower than the actual projected optimal lineup.
This new Value metric is especially useful when you want to compare the trade-off between rostering two players at very different price points who play the same position, as we've just illustrated.
2. Using the New Value Metric to Better Compare Players at Different Positions
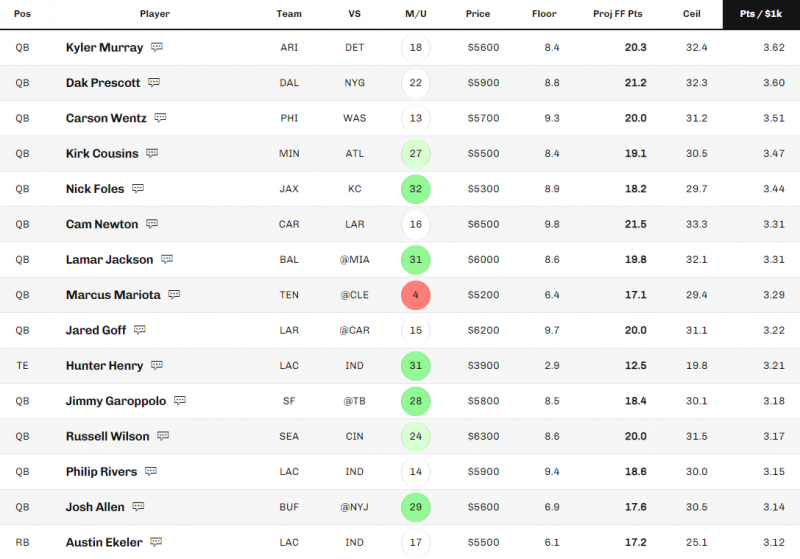
Both DraftKings and FanDuel price QBs in such a way that they average more points per dollar than any other position. How extreme is it? In Week 1, the top 15 players in projected DraftKings points per dollar contains only two non-QBs:

The high number of QBs in the top 15 illuminates the fact that there is a surplus of options at the position, but do little in the way of helping us compare player values, especially that of QBs to non-QBs.
Again, the new Value metric is able to correct this issue. Based on historical data, the Value formula applies a higher baseline expectation for each QB. What results is a more realistic picture of who the top plays on the slate are:

Only one QB cracked the top 15, which is generally how it should be because there will be a myriad of options in a given week; the QB position is more replaceable than others.
FAQs
Does this change the way lineups are generated in the Lineup Generator?
No. The new Value metric reflects the logic the Lineup Generator has always used to generate the most optimal lineups, and will allow for a quick and seamless manual comparison of players at different positions that previously could only be done using the power of the Lineup Generator.
Does this work with floor/ceiling projections?
Yes. As with standard median projections, the baseline expectation is subtracted from the floor/ceiling projection to calculate Value.
Why are some values negative?
If a player is projected to score below his baseline expectation, his Value will be negative. This is common with floor projections because a floor projection is unlikely to be enough to hit the baseline expectation.
Should this always be used instead of points per dollar or points/$1k?
Yes. As detailed above, it is a more accurate way to compare the value of players.


