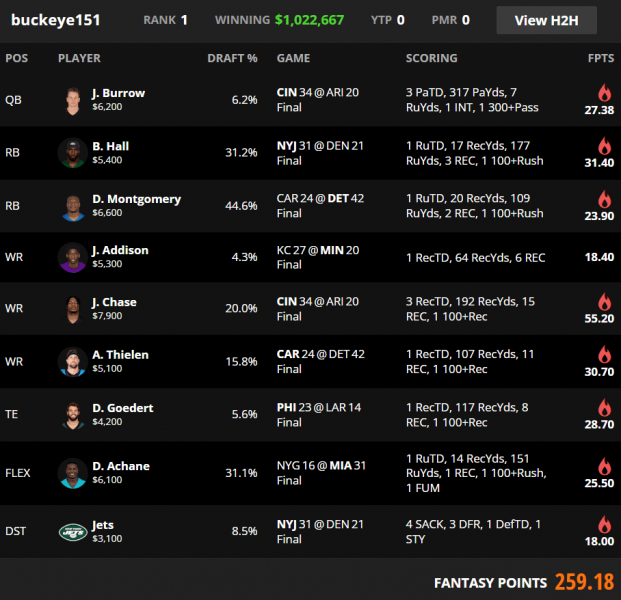
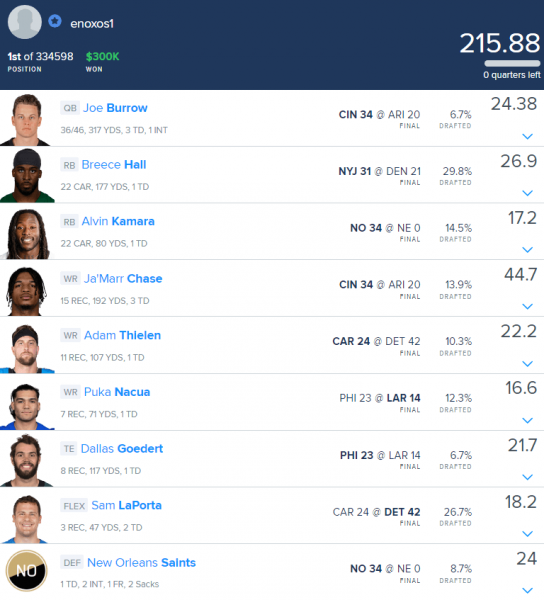
Week 5 DraftKings & FanDuel Winning GPP Lineup Review

In this space each week, I will review the winning lineups from the DraftKings Millionaire Maker and the FanDuel Sunday Million. Analyzing top lineups can help to tease out lineup-building strategies and offer clues on how you could have landed on a similar team.
DraftKings Week 5 Millionaire Winning Lineup

Ownership
| Week | QB | RB1 | RB2 | WR1 | WR2 | WR3 | TE | Flex | Flex Pos | DEF | Cumulative |
|---|---|---|---|---|---|---|---|---|---|---|---|
| 1 | 5.8% | 15.1% | 9.7% | 23.6% | 16.9% | 5.7% | 3.7% | 2.2% | WR | 35.5% | 118.2% |
| 2 | 3.3% | 15.8% | 9.5% | 11.7% | 11.0% | 6.1% | 5.0% | 8.4% | RB | 9.8% | 80.6% |
| 3 | 3.7% | 20.4% | 16.2% | 22.8% | 20.6% | 15.7% | 9.3% | 11.0% | WR | 12.3% | 132.0% |
| 4 | 6.1% | 24.4% | 3.3% | 29.3% | 12.6% | 6.7% | 14.7% | 30.0% | WR | 6.2% | 133.3% |
| 5 | 6.2% | 44.6% | 31.2% | 20.0% | 15.8% | 4.3% | 5.6% | 31.1% | RB | 8.5% | 167.3% |
| AVG | 5.0% | 24.1% | 14.0% | 21.5% | 15.4% | 7.7% | 7.7% | 16.5% | 14.5% | 126.3% | |
| 2022 AVG | 9.7% | 22.2% | 11.2% | 20.3% | 12.6% | 8.3% | 8.5% | 6.1% | 9.9% | 108.7% | |
| 2021 AVG | 7.6% | 19.7% | 9.5% | 17.8% | 11.8% | 7.6% | 10.0% | 4.4% | 7.1% | 95.3% | |
| 2020 AVG | 9.1% | 24.0% | 9.8% | 18.0% | 13.5% | 8.7% | 8.8% | 4.2% | 10.9% | 106.9% | |
| 2019 AVG | 7.8% | 26.7% | 14.5% | 19.7% | 10.3% | 6.6% | 12.6% | 7.9% | 11.1% | 117.4% |
The Week 5 winning Millionaire lineup had a cumulative ownership of 167.3%, the third highest for any Millionaire winner going back to Week 1 of 2019. In that span, this lineup was only the second winner to have two running backs over 30%, let alone three.
Stacks
| Week | Primary Stack | Secondary Stack | Third Stack | Correlated Players |
|---|---|---|---|---|
| 1 | QB/WR/Opp RB | 3 | ||
| 2 | QB/RB/TE | RB/DEF | RB/Opp WR | 7 |
| 3 | QB/TE | RB/WR | 4 | |
| 4 | QB/WR | RB/Opp WR | WR/Opp TE | 6 |
| 5 | QB/WR | RB/DEF | RB/Opp WR | 6 |
Flex
This was the most running-back-heavy slate of the season with 35% of the field rostering three running backs. The field flexed wide receiver in 51% of lineups and tight end in 14%. Top-1% lineups used a third running back 36% of the time, a fourth wide receiver 53%, and three tight ends 11%.
Leverage/Unique Builds
One of the chalkiest games of the week was Bengals-Cardinals but most of the field was off Joe Burrow. Rostering Burrow helped offset Ja'Marr Chase’s ownership.
Vikings-Chiefs was another popular game environment but a one-off 4% Jordan Addison was a unique way to get access to that game.
There were six tight ends with higher ownership than Dallas Goedert, including three in at least 17% of lineups.
FanDuel Week 5 Sunday Million Winning Lineup

Ownership
| Week | QB | RB1 | RB2 | WR1 | WR2 | WR3 | TE | Flex | Flex Pos | DEF | Cumulative |
|---|---|---|---|---|---|---|---|---|---|---|---|
| 1 | 4.3% | 20.2% | 14.9% | 23.3% | 20.0% | 4.0% | 10.9% | 0.6% | WR | 1.2% | 99.4% |
| 2 | 2.2% | 13.1% | 10.8% | 11.3% | 10.7% | 7.1% | 6.4% | 3.3% | RB | 30.5% | 95.4% |
| 3 | 26.4% | 29.7% | 17.4% | 10.7% | 8.7% | 8.2% | 14.0% | 13.6% | RB | 4.1% | 132.8% |
| 4 | 10.0% | 27.1% | 4.2% | 10.3% | 8.0% | 1.2% | 5.4% | 2.2% | RB | 5.5% | 73.9% |
| 5 | 6.7% | 29.8% | 14.5% | 13.9% | 12.3% | 10.3% | 26.7% | 6.7% | TE | 8.7% | 129.6% |
| AVG | 9.9% | 24.0% | 12.4% | 13.9% | 11.9% | 6.2% | 12.7% | 5.3% | 10.0% | 106.2% | |
| 2022 AVG | 12.1% | 30.9% | 20.4% | 26.5% | 15.6% | 9.4% | 10.9% | 9.3% | 10.0% | 145.0% | |
| 2021 AVG | 10.9% | 24.7% | 12.9% | 14.7% | 10.5% | 5.6% | 10.3% | 5.5% | 7.0% | 102.1% | |
| 2020 AVG | 9.2% | 25.3% | 10.2% | 22.1% | 12.5% | 7.8% | 15.7% | 6.2% | 6.1% | 115.2% | |
| 2019 AVG | 7.9% | 19.5% | 5.7% | 18.7% | 11.3% | 8.4% | 7.6% | 3.7% | 6.5% | 89.3% |
Stacks
| Week | Primary Stack | Secondary Stack | Third Stack | Fourth Stack | Correlated Players |
|---|---|---|---|---|---|
| 1 | 0 | ||||
| 2 | QB/TE | RB/DEF | 4 | ||
| 3 | QB/Opp WR | RB/Opp WR | RB/Opp WR | 6 | |
| 4 | QB/WR/TE | RB/Opp WR | 5 | ||
| 5 | QB/WR | RB/DEF | WR/Opp TE | WR/Opp TE | 8 |
Going back to Week 1 of 2019, this was the first time a Sunday Million winner correlated players from four different games. In that span, 70% of winners have used a running back mini-correlation in the same game.
Flex
Only two other Sunday Million winners since the start of 2019 have flexed a tight end.
Leverage/Unique Builds
This lineup left $500 of salary on the table (possibly because of late swap)—it was just the sixth Sunday Million winner over the last 4+ years to leave at least $500 unused.


