The Most Predictable Quarterback Stats

NBC Rotoworld's Denny Carter chatted with our own Jen Eakins on a recent episode of The Most Accurate Podcast about how quarterback rushing breaks the game of fantasy football. That is going to be a common theme today as we dig into statistics that are the most consistent and predictive for QBs.
More Predictable Stats: RB | WR | TE
Methodology
This analysis considered 20 statistics for quarterbacks who started at least eight games in consecutive seasons. Every statistic analyzed is a rate statistic rather than a volume statistic. For example, we’re using yards per attempt rather than total yards in a season. This allows us to more easily compare quarterbacks with a different number of games played.
As for the time period, we’re using 2018-2023 for two reasons. The first is some advanced statistics from NFL Next Gen Stats like completion percentage over expectation (CPOE) are only available starting in 2018. For a deeper dive into these statistics, Matt Okada does an excellent job breaking them down in his Understanding Next Gen Stats article. The second reason is the correlations for the available statistics don’t change drastically if you extend the time period.
Consistent Variables
With all of that said, let’s look at how consistent quarterback stats are year-over-year. The table below shows the correlation of a variable between consecutive seasons. What you’ll notice is the top of the table is dominated by rushing statistics. This is skewed a bit by the existence of pocket passers like Jared Goff who averaged about one rushing yard per game in 2023. In general, though, we have a good idea of a quarterback’s rushing propensity and this is consistent year-over-year.
Importantly, a quarterback’s touchdown rate, which is just passing touchdowns per attempt, is near the bottom of the table. This variable is typically regressed closer to the mean when creating season-long projections, as it isn’t consistent year-over-year. If you could successfully predict the QB with the highest (read: unsustainable) TD rate in a given year, you’d have a massive leg-up on the MVP betting market.
| Variable | Correlation |
|---|---|
| Rush Attempts Per Game | 0.89 |
| Rush Yards Per Game | 0.86 |
| Time to Throw | 0.67 |
| Rush TDs Per Game | 0.63 |
| Pass Attempts Per Game | 0.62 |
| Fantasy Points Per Dropback | 0.6 |
| Pass Yards Per Game | 0.58 |
| Fantasy Points Per Game | 0.54 |
| EPA Per Dropback | 0.5 |
| Completion Percentage | 0.48 |
| ADoT | 0.44 |
| Accuracy | 0.43 |
| CPOE | 0.42 |
| Points Earned Per Play | 0.39 |
| Pass TD Rate | 0.37 |
| Big-Time Throw Rate | 0.34 |
| Pressure to Sack Rate | 0.33 |
| Yards Per Attempt | 0.32 |
| Interception Rate | 0.26 |
| Turnover-Worthy Play Rate | 0.2 |
Predictive Variables
At this point, you might be thinking that it’s all well and good that these statistics are consistent year-over-year. But how does that help me win my fantasy league? We’re getting to that.
The table below extends our analysis further by comparing the correlation of each variable with a quarterback’s fantasy points per game in the next season. Ultimately, that’s what we care about in fantasy land. If you could only look at two variables when drafting your fantasy quarterbacks, the two I would choose are fantasy points per dropback and rushing yards per game. Let’s dig further into both of those.
| Variable | Correlation |
|---|---|
| Fantasy Points Per Dropback | 0.59 |
| Fantasy Points Per Game | 0.54 |
| Rush Attempts Per Game | 0.47 |
| Rush Yards Per Game | 0.47 |
| Rush TDs Per Game | 0.40 |
| Pass TD Rate | 0.35 |
| EPA Per Dropback | 0.33 |
| Points Earned Per Play | 0.31 |
| Yards Per Attempt | 0.28 |
| Big Time Throw Rate | 0.26 |
| Time to Throw | 0.24 |
| ADoT | 0.19 |
| CPOE | 0.13 |
| Completion Percentage | 0.11 |
| Pass Yards Per Game | 0.10 |
| Accuracy | 0.09 |
| Pass Attempts Per Game | -0.07 |
| Turnover Worthy Play Rate | -0.16 |
| Pressure to Sack Rate | -0.17 |
| Interception Rate | -0.25 |
Fantasy Points Per Dropback
As the name implies, fantasy points per dropback is the total number of fantasy points a QB scored in the previous season divided by their number of dropbacks. It is the most predictive statistic I looked at when projecting next season’s fantasy points. And unfortunately, the market is doing a great job incorporating this information. The first three QBs drafted on Underdog at the moment are Josh Allen, Jalen Hurts, and Lamar Jackson. Last year they finished first, fourth, and second, respectively, in fantasy points per dropback among QBs that played at least eight games.
The graph below is a partial dependence plot (PDP) of fantasy points per dropback. PDPs are a great way to shine some light on the inner workings of machine learning models. They show how each variable affects the model’s predictions while averaging out the effects of the other variables. It’s easiest to focus on the orange line in the graph. As that orange line increases above zero on the y-axis, it means QBs in that range typically score more fantasy points next season. The main takeaway here is a rate above 0.55 fantasy points per dropback has been connected to massive fantasy seasons the next year. Alternatively, a rate below 0.45 is a big red flag.

Rushing Yards Per Game
As I mentioned at the top, quarterback rushing breaks this game. It’s consistent year-over-year. It’s one of the most predictive statistics when looking at future-year fantasy points. And it helps to determine the sustainability of a QB’s fantasy points per dropback. By that I mean, my confidence in Lamar Jackson repeating an elite fantasy point per dropback is higher as I know it’s driven partially by his consistent rushing success. I’m more concerned when a pure pocket passer manages an elite fantasy point per dropback because it’s probably driven by an outlier TD rate. And as we saw earlier, TD rate isn’t consistent year-over-year and tends to regress to the mean.
With that in mind, the graph below is a PDP of rushing yards per game. Just like with fantasy points per dropback, it’s easier to focus on the orange line. The takeaway here is that hitting 20 or more rushing yards per game has been connected with a lot of fantasy points in the next season. Alternatively, 10 or fewer rushing yards per game makes that elite ceiling more difficult to hit.

Quarterbacks Who Stand Out
Anthony Richardson
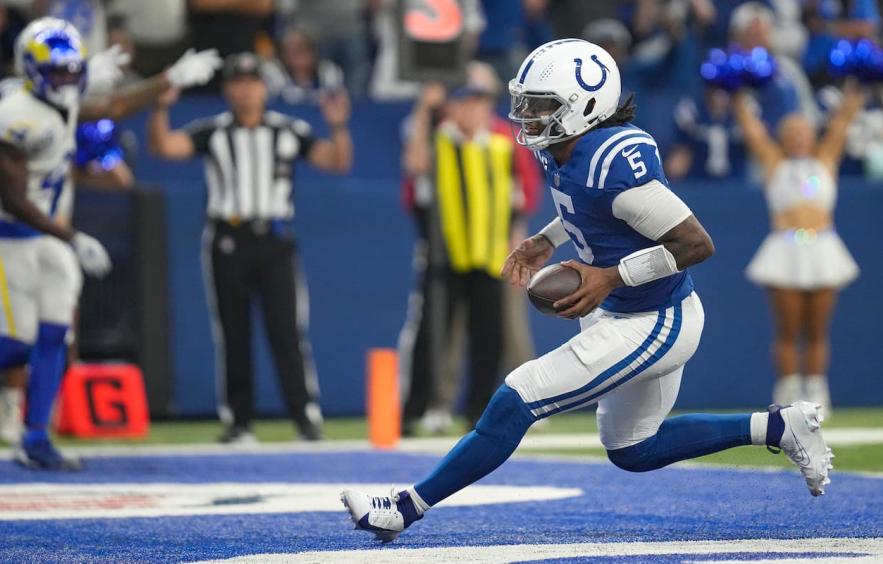
Now I’ve been hiding Anthony Richardson a bit. All of the analysis so far has only focused on QBs who played at least eight games in a season. Richardson didn’t hit that mark last year due to injury. But if we assume he would’ve continued on that path over a larger sample size, Richardson would’ve paced the field last year. He would’ve finished with the fourth-highest fantasy points per dropback since 2018. It’s certainly a leap to project this small sample over a full season. And, unfortunately again, the market is correctly pricing Richardson as the QB5. But the upside case here is obvious.
| Season | Player | FP Per Dropback | |
|---|---|---|---|
| 2019 | Lamar Jackson | 0.91 | |
| 2018 | Lamar Jackson | 0.83 | |
| 2020 | Lamar Jackson | 0.76 | |
| 2023 | Anthony Richardson | 0.74 | |
| 2022 | Jalen Hurts | 0.71 |
Jayden Daniels
Now if the ADP of Richardson is too expensive for your liking, I might be able to interest you in Jayden Daniels. My biggest personal takeaway from this analysis is that I need to draft Daniels more often. The primary concerns I’ve had are two-fold. The first I have with all rookies is that we haven’t seen them perform in an actual NFL game. The second is injury risk due to his slight frame. But the upside case here is tantalizing.
The graph below shows a few key stats from Daniels’ college career. Among QB prospects who have entered the NFL since 2015, Daniels’ scramble rate is 100th percentile. He is the QB drafted outside the top 10 of the position that has the best chance to compete with the elite QB selections. This is your sign to draft Daniels more often in best ball.

Brock Purdy
Brock Purdy is the only pocket passer who finished among the top five in fantasy points per dropback last season. As mentioned earlier, pocket passers with elite fantasy points per dropback are typically driven by high TD rates. And that’s exactly the case with Purdy. His 7.0% TD rate in 2023 was about three percentage points above the average and nearly a full percentage point above Dak Prescott in second place.
Now Purdy is an interesting case. He’s had a massive TD rate in consecutive seasons. Perhaps you can continue to expect an above-average TD rate for him given his outlier offensive weapons and scheme. And you’re not having to pay for his outlier performances with an ADP of QB13. He’s not someone I’m going out of my way to get, but he’s perfectly fine stacked with Brandon Aiyuk who I promise will be mentioned often in the WR version of this article series.
Joe Burrow
Joe Burrow was the most surprising name to pop up with a lot of red flags. He averaged only about nine rushing yards per game in 2023 and his 0.39 fantasy points per dropback were easily below our 0.45 red flag benchmark. Now, you can explain away this performance easily due to injuries. And in 2022, he cleared 16 rushing yards per game and a near-elite 0.54 fantasy points per dropback. But unless I’m stacking him with Ja’Marr Chase, I don’t see a massive difference between Burrow and Dak Prescott who I can draft a round later.
Bottom Line
- Fantasy points per dropback is the most predictive variable for next season’s QB fantasy points. You want to target QBs with a fantasy point per dropback mark above 0.55 and avoid QBs that fall below 0.45.
- Rushing yards per game is the second most predictive variable for QB fantasy points. You want to target QBs that run for more than 20 yards per game.
- Rushing yards per game provide additional clarity on the sustainability of elite fantasy points per dropback performance.
- Jayden Daniels is the QB drafted outside the top 10 of the position that has the best chance to compete with the elite QB selections.


