FFPC Win Rates: Running Backs

The running back position is held in higher regard than most of the others when it comes to best-ball leagues. A limited supply of all-purpose rushers puts the squeeze on drafters early and often once we're on the clock. However, there are phases in the draft that become more optimal to take our swings at the position rather than blindly firing to avoid missing out.
FFPC Win Rates Series: QBs | WRs
My first piece on roster construction set the foundation for the position. I covered how many draft slots to use, optimal tendencies per round, and an overview of how to approach the rookies. Personal bias aside, it’s a solid introduction to the format. But there’s some additional nuance to the position. To break it down further, I looked at usage profiles, opportunity cost, and the production required to get into the Top 12 over at FFPC.
Highest RB Win Rates
| Rank | Name | Win Rate | ADP |
|---|---|---|---|
| 1 | Alvin Kamara | 24.10% | 1.05 |
| 2 | Dalvin Cook | 18.10% | 1.06 |
| 3 | Antonio Gibson | 14.70% | 6.06 |
| 4 | Nyheim Hines | 14.10% | 14.03 |
| 5 | Aaron Jones | 11.60% | 2.05 |
| 6 | David Montgomery | 11.50% | 5.02 |
| 7 | Rex Burkhead | 11.30% | 24.07 |
| 8 | Jonathan Taylor | 11.20% | 3.08 |
| 9 | Jerick McKinnon | 11.00% | 16.04 |
| 10 | Derrick Henry | 10.90% | 1.08 |
| 11 | Latavius Murray | 10.80% | 9.11 |
| 12 | Darrell Henderson | 10.80% | 11.1 |
Similar to the Top-12 quarterbacks, this list isn’t very surprising at first glance. All were popular plays in either season-long or DFS formats throughout the season. But in best ball, we need a player’s production over the course of the season relative to their draft cost. When you combine those two data points, we can start to see some trends in regards to drafting running backs.
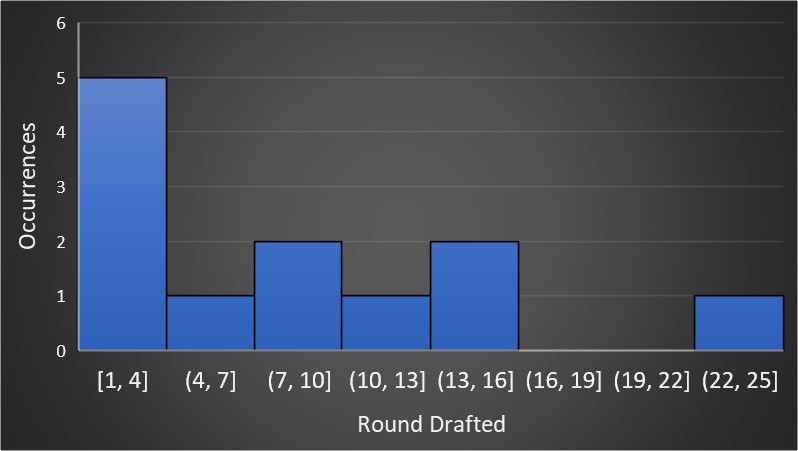
Using a histogram, we can see when drafters were finding the most value at running back. The early rounds pop off the chart, as 50.0% of the Top 12 is comprised of early-round running backs. But you can see a quick drop-off around the fourth round. It’s at this point where wide receivers outpace running backs and the position becomes overvalued. Let’s use the one example from last year as a jump-off point.
David Montgomery was the only running back (out of 14) from Rounds 4-7 to make the Top 12 and the reason for his success is clear: workload. After Tarik Cohen’s injury, Montgomery became a bell-cow running back finishing the season with 92.5% of the team’s running back carries. A clear outlier in usage, as he toted 76.3% the year prior, it serves as a reminder that opportunity dominates the running back position.
Ball carriers don’t have the same ability as receivers to make spike weeks on limited touches. There isn’t a ‘DeSean Jackson of running backs’ for a reason. The top producers need the combination of situation and multi-faceted usage to go with their ADP. In order to highlight this, I broke the draft down into phases to tease out usage profiles we can take into our upcoming drafts.
Early Rounds
| Rank | Name | Win Rate | ADP |
|---|---|---|---|
| 1 | Alvin Kamara | 24.10% | 1.05 |
| 2 | Dalvin Cook | 18.10% | 1.06 |
| 3 | Antonio Gibson | 14.70% | 6.06 |
| 5 | Aaron Jones | 11.60% | 2.05 |
| 6 | David Montgomery | 11.50% | 5.02 |
| 8 | Jonathan Taylor | 11.20% | 3.08 |
| 10 | Derrick Henry | 10.90% | 1.08 |
You see the names and the descriptors bell-cow or alpha come to mind. Subjectively, they offer the workload required to be a top running back in fantasy. But the term ‘workload’ is ambiguous. For example, Henry’s workload differed from Kamara’s and yet they both paid off in spite of their ADP. So, we need to delineate how each was used within their offense to make logical comparisons. Let’s start with total rushing attempts.

I used just two years’ worth of data, but we can see that total attempts correlates with scoring. Simply put, more carries eventually lead to more touchdowns. So, at the very least, we’d expect our early-round backs to tote the rock on a majority of their team’s snaps. Recent history would agree.

Overall, running backs drafted in the first six rounds over the last two years have averaged a 66.7% share of their team’s carries. First-round running backs have tilted the scales with an average of 76.5% as the opening of most drafts consists of the true bell-cows in the league. Cook, Henry, and 2019 McCaffrey have exemplified what we expect out of the first round. But then there’s Alvin Kamara down at 51.5%. Despite splitting a backfield with Latavius Murray, Kamara had the highest win rate for his position. Such an outlier points to the much-needed passing game utility which lifted him, and others, well above their peers.
| Name | Target Share |
|---|---|
| Alvin Kamara | 22.0% |
| Dalvin Cook | 13.0% |
| Derrick Henry | 7.0% |
| Aaron Jones | 14.0% |
| Jonathan Taylor | 8.0% |
| Antonio Gibson | 9.0% |
| David Montgomery | 11.0% |
Kamara’s 22.0% target share, when combined with his rushing share, is why he topped the charts. For context, he had more targets than A.J. Brown. But while he performed like a WR1, the other early-round running backs were able to make value on a minimum 7.0% target share in their respective offenses. Overall, running backs selected in the early rounds have averaged a 12.0% target share.
And while consistent usage in the passing game is seen as a positive, it’s not just a way to accumulate a few extra points per game. They should be seen as additional opportunities to score touchdowns. All seven of the early-round running backs were in the Top 10 for total touchdowns scored during the regular season. Since 85.8% of the rushing touchdowns were scored from within the 20-yard line in 2020, early-round running backs should have the majority of the opportunity in this area.
| Name | % of Teams RZ R-Atts | RZ Target Share |
|---|---|---|
| Alvin Kamara | 63.4% | 19.8% |
| Dalvin Cook | 74.4% | 3.2% |
| Derrick Henry | 80.8% | 1.5% |
| Aaron Jones | 55.4% | 11.4% |
| Jonathan Taylor | 53.3% | 6.5% |
| Antonio Gibson | 48.3% | 5.0% |
| David Montgomery | 91.3% | 11.8% |
Committees are expected in today’s league, but the running backs drafted in Rounds 1-6 have taken the majority of the workload in the red zone. Across the 2019 and 2020 season, running backs drafted early that wound up in the Top 12 have averaged 68.0% of their team’s red zone carries. In addition, they’ve maintained their passing volume in the red zone with a 10.0% target share. All of this points to the type of player we’re looking to use significant draft capital on when drafting our teams. But other players have fit the description in the past that weren’t successful. We’re missing something.
When Le’Veon Bell was the starter for the Jets in 2019, he had a 20.0% target share and 76.0% of New York’s red-zone attempts. Josh Jacobs carried the rock on 75.0% of Las Vegas’ red-zone attempts with a 4.0% target share. They generally meet the workload we want but never made it into the Top 12. Where they fell short was the quality of their offense.
| Name | Yards Per Drive (Rank) | Points Per Drive (Rank) |
|---|---|---|
| Alvin Kamara | 16th | 6th |
| Dalvin Cook | 12th | 10th |
| Derrick Henry | 3rd | 2nd |
| Aaron Jones | 2nd | 1st |
| Jonathan Taylor | 7th | 11th |
| David Montgomery | 24th | 22nd |
| Antonio Gibson | 31st | 27th |
Only Montgomery and Gibson were attached to below-average offenses in 2020. McCaffrey, Cook, and Carson were similar cases coming out of 2019. Overall, 70.6% of the running backs drafted in the early rounds that have made it into the Top 12 have been a part of above-average offenses. Team situations like these are what provide the high-value touches like targets and red-zone attempts. Without a wholly productive offense, we’re looking at just high volume without the scoring opportunities we really need in order for the running back to be a value this early in the draft.
Favorite Early-Round RBs for 2021: Ezekiel Elliott (ADP 1.09), Aaron Jones (ADP 1.12), Najee Harris (ADP 3.01), Clyde Edwards-Helaire (ADP 3.01), Chris Carson (ADP 4.06)
Middle Rounds
| Rank | Name | Win Rate | ADP |
|---|---|---|---|
| 4 | Nyheim Hines | 14.1% | 14.07 |
| 11 | Latavius Murray | 10.8% | 10.03 |
| 12 | Darrell Henderson | 10.8% | 11.05 |
Notice the gap in ADP between the early and middle rounds. The last of the early-round players (Gibson and Montgomery) floated around Rounds 5 through 7. We don’t see another Top 12 running until the 10th round in Murray. Last season was similar in 10 of the Top 12 running backs drafted in the early rounds. Just Latavius Murray (7th round) and Jamaal Williams (17th round) made the list. Opportunity cost becomes a critical consideration in this phase of the draft.

We only had three Top-12 running backs, but you see what they were competing against when drafters were considering overall roster construction. Eight Top-12 quarterbacks were drafted in this part of the draft. We also had Top-12 receivers like CeeDee Lamb, Diontae Johnson, and Jamison Crowder available. The key here was identifying not just standalone opportunities, but week-to-week touches that would sustain a running back’s value throughout the season.
‘High-value handcuffs’ were what we were clamoring for at this point in drafts last year. Think of guys like Alexander Mattison, Duke Johnson, and Zack Moss that would benefit from an injury or change in situation. But, for most, that spark to ignite boost their value never came. And while we were left holding the bag, the few with weekly value continued to increase their season totals and allowed them into the Top 12.
| Nyheim Hines | Latavius Murray | Darrell Henderson | |
|---|---|---|---|
| Games w/ Most Tchs | 3 | 2 | 8 |
| Split w/ Lead RB | 3 | 5 | 3 |
| Target Share | 13.0% | 5.0% | 5.0% |
| RZ Share | 40.2% | 32.3% | 41.9% |
| Total TDs | 7 | 5 | 6 |
Murray got by on just two games as the primary rusher for the Saints. Henderson and Murray both had meager target shares at 5.0% (albeit useful for fantasy purposes). However, all three earned significant roles in the red zone. Mid-round backs that finished in the Top 12 earned a 30.0% or more touch share within the red zone over the course of the 2020 season. It’s what led to all three outscoring everyone in total points except for Chase Edmonds. So, while trying to find the ‘lottery ticket’ that can ‘win your league’, the optimal play has been to find weekly contributors with minor passing game work that can be used in high-value situations.
Favorite Mid-Round RBs for 2021: Mike Davis (ADP 7.01), Trey Sermon (ADP 10.02), Zack Moss (ADP 11.01), Gus Edwards (ADP 11.12), Darrell Henderson (ADP 13.02)
Late Rounds
| Rank | Name | Win Rate | ADP |
|---|---|---|---|
| 7 | Rex Burkhead | 11.3% | 22.07 |
| 9 | Jerick McKinnon | 11.0% | 16.04 |
The players at this phase of the draft benefited from a number of injuries. Rex Burkhead was active for just the first 10 weeks of last season. In that span, Damien Harris missed four games, Sony Michel was on the Reserve/COVID-19 list for seven games, and Damien Harris was on IR for the first month of the season. McKinnon watched the trio of Raheem Mostert, Jeff Wilson, and Tevin Coleman miss a combined total of 23 games.
Regardless, their opportunity profiles were similar to the mid-round players we were trying to grab multiple rounds earlier.
| Jerick McKinnon | Rex Burkhead | |
|---|---|---|
| Target Share | 9.0% | 12.0% |
| RZ Share | 42.7% | 37.0% |
| Total TDs | 6 | 6 |
Again, the combination of being involved in the passing game plus a significant workload from within the 20-yard line is the key. Late-round running backs that finished in the Top 12 have maintained a minimum of 9.0% target share and 35.0% share of the touches from within the 20-yard line. Jamaal Williams slid right into the backend of the Top 12 in 2019 with a 9.4% target share to go along with his 32.8% red zone touch share. So if the market is excited about a primary rusher, look for his backup in the later rounds if the backup can be used all over the field if given the chance.
Favorite Late-Round RBs for 2021: Devin Singletary (ADP 16.01), Darrel Williams (ADP 23.04), Joshua Kelley (ADP 23.08), Salvon Ahmed (ADP 26.02)
Rookies
Since the draft hype is still in effect and 'rookie fever' has taken over the lobbies, I looked at the new additions to the league as a whole for some trends.
| Season | Name | Win Percentage | ADP |
|---|---|---|---|
| 2019 | Miles Sanders | 13.9% | 6.04 |
| 2020 | Antonio Gibson | 14.7% | 6.06 |
| 2020 | Jonathan Taylor | 11.2% | 3.08 |
Opportunity cost stands firmly in the way of betting primarily on talent when it comes to rookies. We can project and lean on press conferences all we want. However, wide receivers, quarterbacks, and some tight ends typically have had a better chance at returning value. However, if you’re going to invest, the workhorses have been the better bets to wind up in the Top 12.
| Miles Sanders | Antonio Gibson | Jonathan Taylor | |
|---|---|---|---|
| Games w/ Most Tchs | 5 | 7 | 7 |
| Split w/ Lead RB | 5 | 4 | 5 |
| Target Share | 10.2% | 7.9% | 7.3% |
| RZ Share | 41.4% | 37.8% | 48.9% |
| Total TDs | 6 | 11 | 12 |
Rookies have averaged 4.3 Top-12 finishes and 2.6 Top-24 finishes in their first year over the last two seasons. While all have split time in their freshman campaigns, their opportunity (both as receivers and rushers in the red zone) catapulted them into spike weeks with multiple RB1 results. A strong indicator of such an opportunity in their first year is draft capital. Gibson has the least capital of all three as he was drafted in the third round (66th overall). Regardless, no one outside of the third round has managed to get into the Top 12. Unless you can find 2021’s James Robinson, the draft itself can give us clues as to which rookies have the best shot at being valuable assets in our best-ball portfolio.
Favorite Rookie RBs for 2021: Najee Harris (ADP 3.01), Javonte Williams (ADP 5.04), Trey Sermon (ADP 10.02)
Bottom Line
Early-round running backs need a combination of workload, high-value touches, and a productive offense to be a Top-12 value in best-ball drafts.
-
Running backs drafted in the first six rounds over the last two years have averaged a 66.7% share of their team’s carries.
-
They’ve averaged 68.0% of their team’s red zone carries while maintaining a 10.0% target share.
-
70.6% of the running backs drafted in the early-rounds that have made it into the Top 12 have been a part of above-average offenses in terms of offensive yards per drive and points per drive.
Weekly production and a path to spike weeks are critical for running backs taken in the middle rounds. Just hunting for ‘injury upside’ will likely burn a roster spot.
-
Mid-round backs that finished in the Top 12 earned a 30.0% or more touch share within the red zone over the course of the 2020 season.
Try and capture ‘injury upside’ in the late rounds. Otherwise, look for the 1B or ancillary back that has a role in the passing game and plays in the red zone.
-
Late-round running backs that finished in the Top 12 have maintained a minimum of 9.0% target share and 35.0% share of the touches from within the 20-yard line.
Rookie running backs need to produce often (not necessarily early) throughout their first season.
-
Rookies have averaged 4.3 Top-12 finishes and 2.6 Top-24 finishes in their first year over the last two seasons.
-
Draft capital is worth considering. No rookie outside of the third round has finished in the Top 12 over the last two seasons.

