The Ultimate Underdog Best Ball Mania V Draft Guide

Welcome to the Ultimate Underdog Best Ball Mania V Guide for 2024!
Best Ball Resources: Extreme Underdog Best Ball Roster Construction: When to Stop Drafting WRs | An Intro to Best Ball Leagues | Anatomy of a 'Better in Best Ball' WR | How Draft Date Impacts Best Ball Leagues | How to Approach Underdog 3-Team Best Ball Drafts | Weeks 15-17 Targets for Best Ball Tournaments
Using Data in Best Ball
As I touched on in my initial “Intro to Best Ball” article, best ball enables players to modulate their level of investment to their exact level of interest in fantasy football. Completing a few drafts to enjoy and track during the upcoming season sounds ideal to some players. To others, the melding of game theory, data and unknown makes it an interest plenty of people, including myself, want to invest more heavily.
Football has been gamified for decades, but best ball is a relatively young format without extensive records to move us closer to an equilibrium. The extent of the data available to us is largely contained to Underdog’s Best Ball Mania, which has released data for the past four years. With only four large-scale best ball tournaments to reflect on, we cannot be overly reliant on the observed outcomes.
When approaching any topic or data “nuggets”, we must first consider if this holds any weight logically. Could we have reasonably expected these outcomes before diving into the data? If the answer is no, our confidence should diminish. We’re sure to find noise in the limited sample available to us.
For example, if someone looks into when to draft a TE and determines that taking a TE in Round 1 is optimal, we should approach this with healthy skepticism. How many TEs go in Round 1? How many years do we have data to back this up? The data may “prove” it is a plus EV strategy regardless of year, but only a legendary TE, read Travis Kelce, has consistently been drafted in the first round. In this case, the data does not “prove” TEs in Round 1 are a fantastic opportunity, but rather, it describes that Travis Kelce has been a legend at the position for fantasy.
Specifically with onesie positions, we should be more skeptical of our findings, as the sample of player careers and player years is much more limited than at running back and wide receiver. Last year, several mid-round quarterbacks were injured for significant portions of the fantasy season. Patrick Mahomes, Josh Allen, Lamar Jackson, and Jalen Hurts played in every fantasy-relevant game. Consequently, higher QB investment strategies should have seen a minor bump in performance. This is not reliably replicable. There is no logical reason these quarterbacks should get hurt significantly less than most other quarterbacks.
When we zoom out and approach problems on a higher level, lessons become more broadly applicable moving forward. People will always point out the limitations of using descriptive data as predictive, but taking lessons from the data available should improve our strategy if we approach problems inquisitively. If all four years of data point in the same direction, I’m inclined to take that trend seriously.
I’m not as interested in honing my micro takes as I am in finding out how to be directionally accurate moving forward.
Some findings can be so powerful, clear, and prevalent that they become somewhat self-defeating. My mind often wanders back to Goodhart’s Law, “When a measure becomes a target, it ceases to be a good measure.”
“Who cares about the words of an English economist, we’re playing fantasy football? That dude didn’t know ball!”. Evidently, I care about him too much. These words can be widely applicable in numerous areas, including best ball. Looking at past years’ data, seeing what is successful, and tailoring your approach to those data inherently means you will be behind the here and now. As people set strict draft capital bucket goals, reliably adhere to rules for how many players at each position we should have by a certain point, or require a set number of stacks they are failing to adjust to the current environment.
Seeing that wide receiver-heavy teams have performed the best till this point and becoming a dogmatic card-carrying member of the zero-rb brigade likely will not serve you as well as you theorize. This could still pay off but we’re dealing with different opportunity costs. When selecting a wide receiver in Round 5 we’re considering Jayden Reed vs. Josh Jacobs. The proposition has shifted compared to previous years. If enough people buy into a set of beliefs or drive toward certain metrics, they no longer hold the same meaning they previously did.
The data serving us should act as guides, not targets. Once we begin to measure in absolutes anchored to past results, the data loses much of its usefulness. Dealing with descriptive data for the most part, considering how past takeaways apply to the current environment separates decent to good drafters from potentially great ones.
With those given caveats, what has worked and how can it be applied moving forward?
ADP Value
As mentioned earlier, much of the “research” for best ball should, in my opinion, try to avoid leaning into specific players. This is not to say we should not care about the individual players we’re selecting, but rather finding overarching trends and more easily applied lessons should provide more reliable benefits moving forward.
If presented with the option to know the best way to allocate draft capital efficiently or which players performed the best this season, no reasonable person would pretend optimizing draft capital would outperform “playing the best plays”. Practicing and living by a “play the best plays” philosophy is much more difficult in practice than in theory. In the spring and the summer, we can all stand tall and say player X doesn’t offer meaningful upside, is stuck in a bad offense, and should see his role decrease with increased competition. Once fall rolls around, we’re re-introduced to the reality and randomness of football. A few outlier games or plays define players’ seasons. Overlooking one piece of data, quantitative or qualitative, can lead to our downfall. Accordingly, we should be open to being incorrect.
Use the information in the market baked in from thousands of drafts to keep yourself accountable. Do you genuinely think there is no way Amari Cooper could outperform George Pickens on a weekly and season-long basis? Perhaps you do, and more power to you for possessing the confidence I search for every time I try to talk to girls. Unfortunately, there is a considerable chance this confidence is misplaced. Occasionally mix in players you do not like, particularly when they fall past their average draft position.
As I briefly touched on in my Intro to Best Ball article, drafting players past their ADP enables you to make bets on players at favorable prices. If a player falls 12 picks past their ADP, the performance you need from them to exceed your investment is lower. This is comparable to line shopping in sports betting. Betting a line at -110 compared to +100 may seem like a minor difference but this can be the difference between winning and losing.
In each case, it remains unlikely this minor spread in prices drives a major difference discrepancy in team performance. Compounding this minor impact over many drafts and players creates a meaningful difference.
Putting these intuitive thoughts to the test, it can appear as if merely taking the top pick at each turn will not help but it may hurt your performance. Looking at the 14 rounds, forgoing the top available player in each round puts you in a massive hole. Decreasing your initial advance rate from 0.167 to ~0.126 tanks the team's expected value from $22.30 to $16.83. Making up for this lost EV in the playoffs will be extremely difficult, especially as having worse ADP value continues to hurt your odds in each successive round.
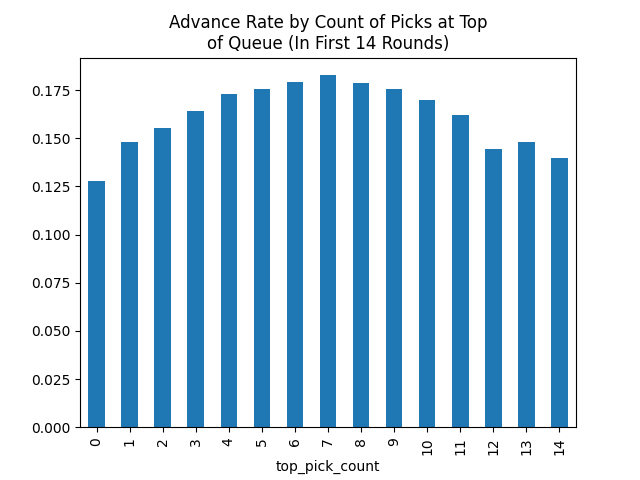
Interestingly, this decrease in value, while not as stark, occurs at the top end as well. The teams in the middle which took the top-ranked player about half the time had the best chance of advancing. The limitations of breaking down data in this manner become apparent quickly. Teams only taking the top available player are not paying attention to positional allocation and are likely auto-drafted.
When shifting from the top ADP available to the top positional player available, the benefit becomes more apparent. Some teams with only taking the top available player a couple of times may have operated in unusual rooms where a position went at a premium requiring them to adjust. The issue of auto-drafters persists as they should always get the top player available at the position picked.
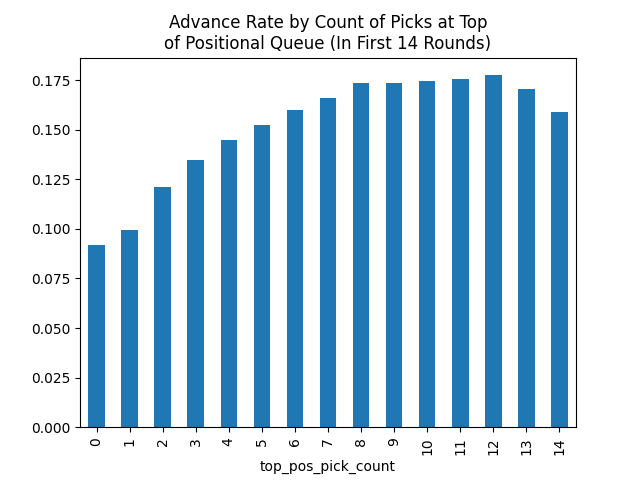
The data in this section is only from BBM IV because there were additional fields available that helped accentuate the value of using ADP. In particular, the data contains a field that designates whether a pick was manually clicked, came from ranks, came from the queue, or auto-drafted from ADP.
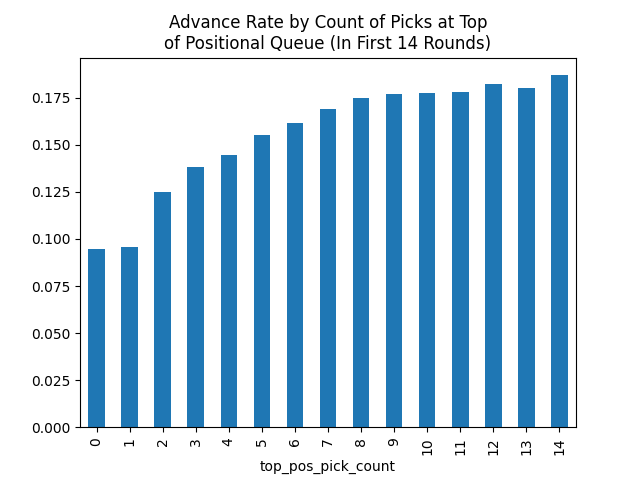
Filtering to teams who manually picked at least 10 of their first 14 picks, the top end of the spectrum becomes the highest advance rate. Simply by respecting your opponents and having some humility your advance rate should improve. In addition, to improving your results this way, scooping value can provide uncommon avenues to differentiation. Plus the benefit of ADP value carries over from round to round. The benefit is largest in the first round, but it continues to give a minor boost or dock to teams in later rounds.
All of this has only looked at live ADP value. Of course, closing line ADP value provides meaningfully more value than live ADP value. ADP can carry momentum as it is a lagging indicator and the market takes time to react to news. Below is a correlation matrix between live ADP value, closing ADP value, live draft capital value, and closing draft capital value. In the majority of situations, the current ADP remains close to our best estimate for the closing ADP.
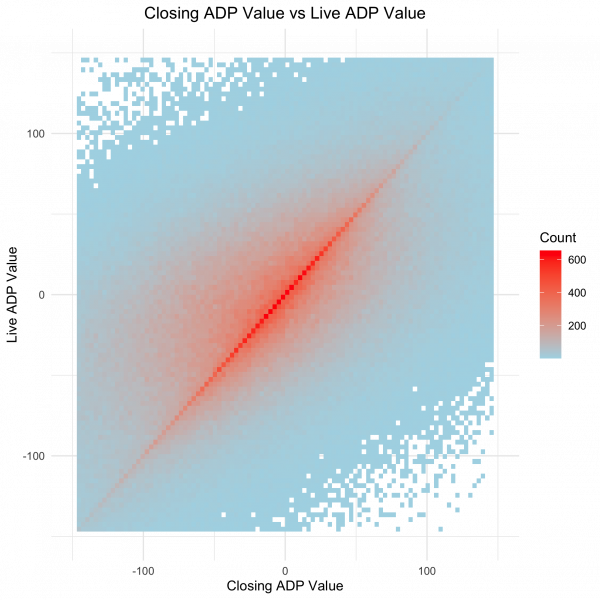
Teams closing line ADP value and live ADP value can look very different, but in most cases, they are rather close.
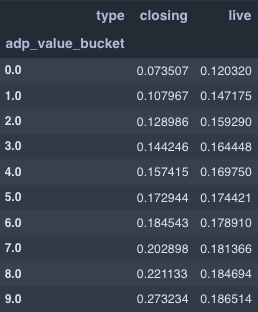
Closing line ADP value buckets show much more signal than live ADP value buckets, but the trend is still apparent with live ADP value. We should give more credence to ADP later in the summer as more information is taken into account and there is less time for lines to shift.
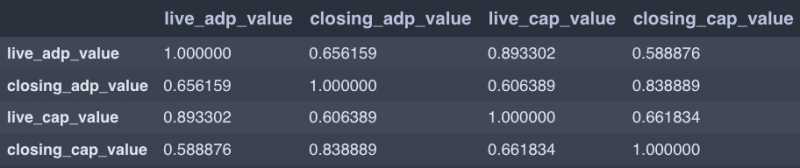
ADP value and draft capital value are closely aligned when looking at both live and closing lines.
All of this is not to say remove name labels and draft without bias. While acting like a computer at a certain point likely helps, it certainly removes much of what makes this game fun. We’re operating in a space with wide error bands, difficult-to-measure talent, a high degree of randomness, and a lot of diverse opinions. Approach the game accordingly and have humility with your initial thoughts. While I think the market has overcompensated for projectable volume backs like Josh Jacobs and Joe Mixon, I will not be ending up with 100% exposure.
Large fade stances can be much less detrimental than overeager endorsements of players. We can only be 8.33% below our expected ownership, but we can be 91.17% over our expected ownership. Early stances also tend to be the most costly, so use this to inform your decisions, but respect the market when signing up for best ball drafts.
In the past, I have looked at ADP in a myriad of ways using previous BBM data, please check my Twitter if you are interested.
Draft Capital
Before diving into high-level team structure trends for each year of BBM, I’d like to spend a small amount of time describing my approach. A simple way to define a team structure would be by listing the number of players at each position. One of the most common structures is 2/5/8/3. Limiting your description to a count removes the context of some of those picks though. Starting with three TE picks in a row looks and performs considerably different than ending your draft with three TE picks.
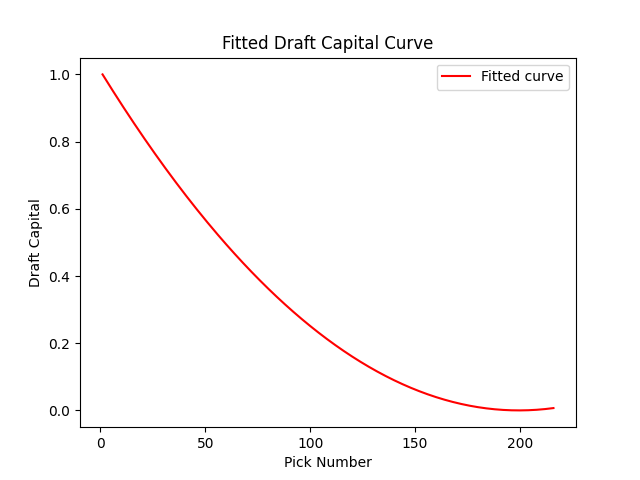
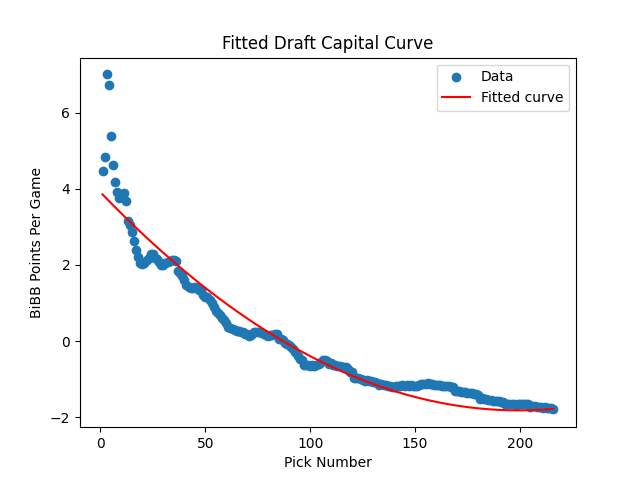
To capture this difference, we’re going to utilize draft capital buckets. Mike Leone and Sam Hoppen have written about draft capital curves in the past. In this case, I decided to tie my draft capital value back to Hayden Winks’s “better in best ball points”. Once again, there will be minor differences in how we calculated these figures but the variance should be mostly negligible.
This is based on BBM II, BBM III, and BBM IV data, giving more weight to earlier iterations of BBM because there are more data points in the BBM IV than in previous iterations. I tried to avoid overfitting while testing different formulas and used a model that was less fit than others to avoid giving excessive weight to the earliest picks.
In all likelihood, this underweights the value of the first few picks in a draft environment. While we perceive stark and clearly delineated tier breaks in rankings, this is uncommon to reflect reality. The largest drop in draft capital should occur immediately as only a few players are vying for the top spot. These players have pedigree, opportunity, and past success to such an extent even other elite players frequently lag behind them. After that, tier breaks are more debatable and smooth, rather than clear and abrupt.
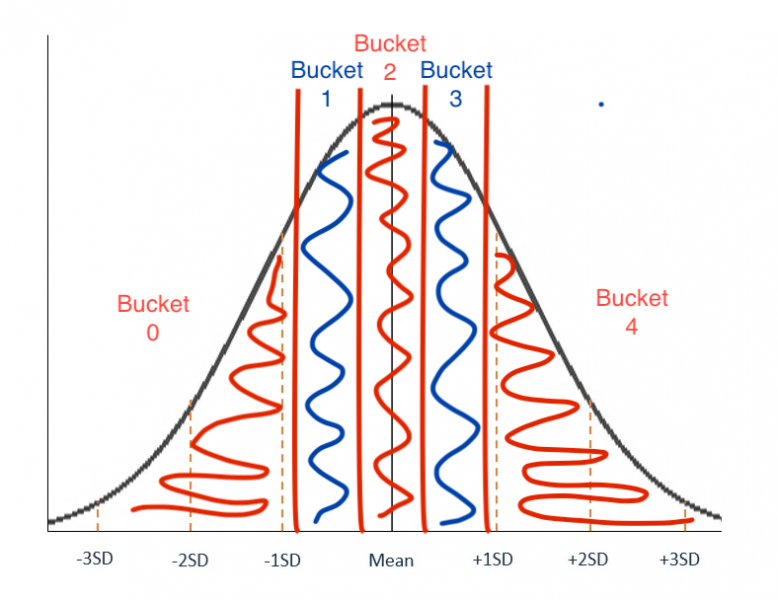
Grouping teams into draft capital buckets allows us to leverage aggregated data for more general points. Looking at more granular levels allows for more yearly randomness and bias to enter our analysis. In most cases, teams will be broken into one of five buckets. Bucket zero contains the teams with the lowest draft capital expenditure at the position, and bucket four contains the teams with the most draft capital expenditure at the position.
Buckets are grouped based on positional draft capital expenditure percentile. This means each bucket will contain 20% of all teams. The range of capital spent will be narrower in bucket two than in buckets zero and four because capital spent at a position likely closely reflects a normal curve.
In the diagram below, you get the chance to see why I am actually a full-time artist moonlighting as a fantasy football writer. The middle quintiles are more condensed than the ends.
Applying buckets from one year to the next can be difficult because the draft environments can diverge from previous years. Directly applying previous years’ buckets would result in a disproportionate amount of teams falling into higher draft capital buckets for wide receivers and lower draft capital buckets for running backs. I’m open to other approaches like the percent of positional capital relative to the draft at large or only looking within positional ranks to reduce the importance of shifts when moving from year to year.
In the following subsections, the columns are the draft capital buckets for the position currently being looked at.
Approaching WR
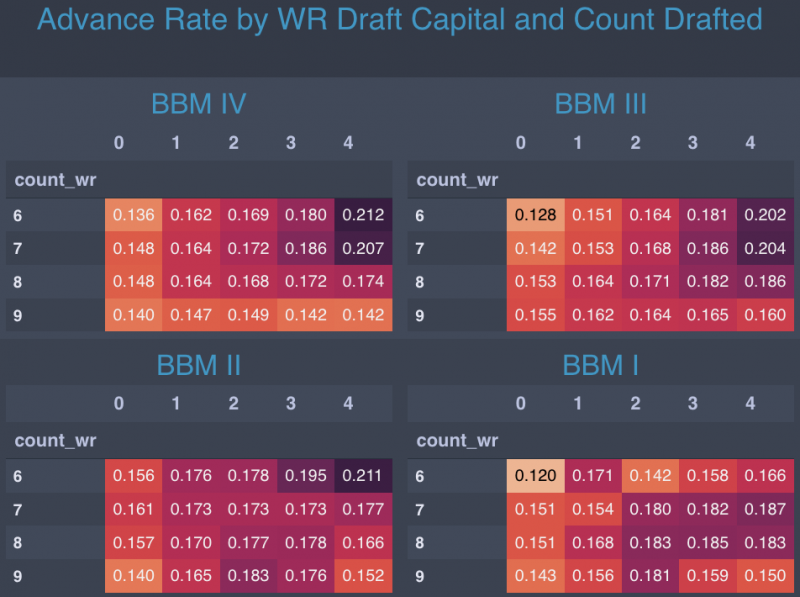
The wide receiver pivot tables take little time to digest, concentrating your bets on a limited number of high-end receivers has yielded consistently strong results. One underrated strategy in the past has been limiting yourself to only six receivers. For a select group of highly online fantasy players, wide receiver is viewed as the best pick at almost every turn, but like any position you reach points of diminishing returns. Additionally, we tend to see less breakouts coming from the late rounds.
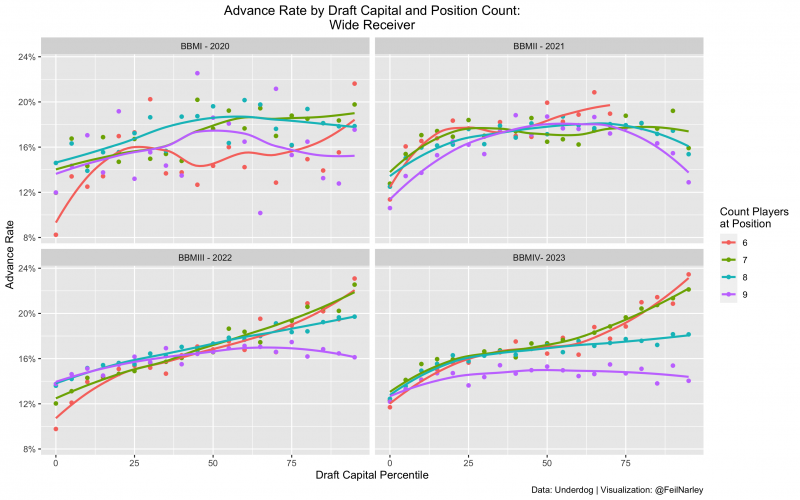
Wide Receiver advance rate by draft capital expenditure and count of wide receivers drafted.
Does this mean we should always rip wide receivers immediately and stop at six? Of course not, this data describes past years' results. The environment we find ourselves is more wide receiver-heavy than ever. Teams stopping at six receivers in the past may have had five top 30 wide receivers by ADP. Attaining a team like that now would require a remarkable anomaly and a room of drafters ready to fight an ideological battle against ADP. Sadly the Fantasy Counselor can only occupy one draft slot in a given draft room.
I’m more inclined to draft seven or eight receivers than in past years because the value proposition of drafting the RB12 is remarkably different than in years past. Simultaneously, fully fading the trend we’re observing would appear to be a mistake. Much has been made of the wide receiver ADPs continually being pushed up, but while the difference is meaningful, it does not appear unwarranted.
Applying my thoughts that the prevalent draft capital curves are likely underrating the importance of early picks, starting with three or four wide receivers and then attacking the new value pockets at other positions offers an interesting approach this year. Banking early high-end production ensures you should be well suited at the wide receiver position even when taking more "detours" than many would encourage.
Approaching RB
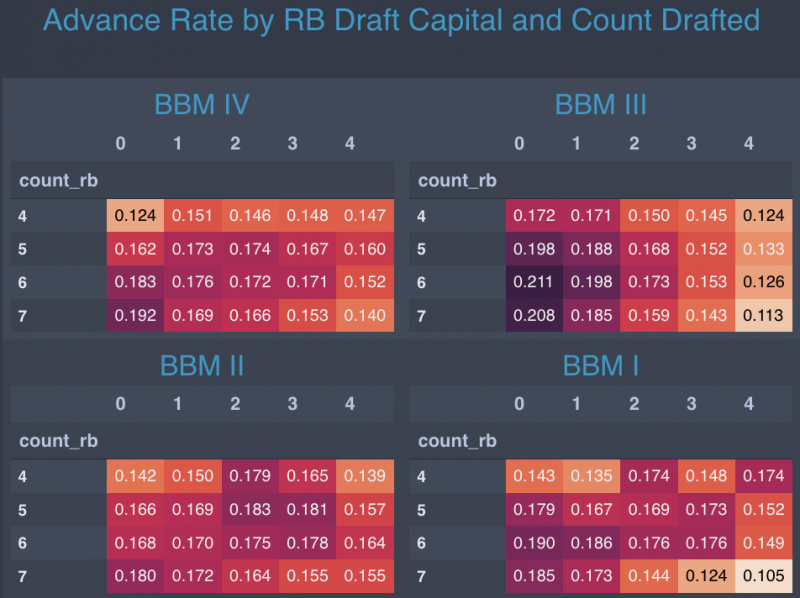
Running back offers a slightly more mixed bag than wide receiver, where the trend is undeniable. With that said, “slightly” may be the operant word in that sentence. Lower draft capital expenditure on running back has consistently performed at or above expectations. Hence why more people lean into the “Zero RB” drafting strategy every year.
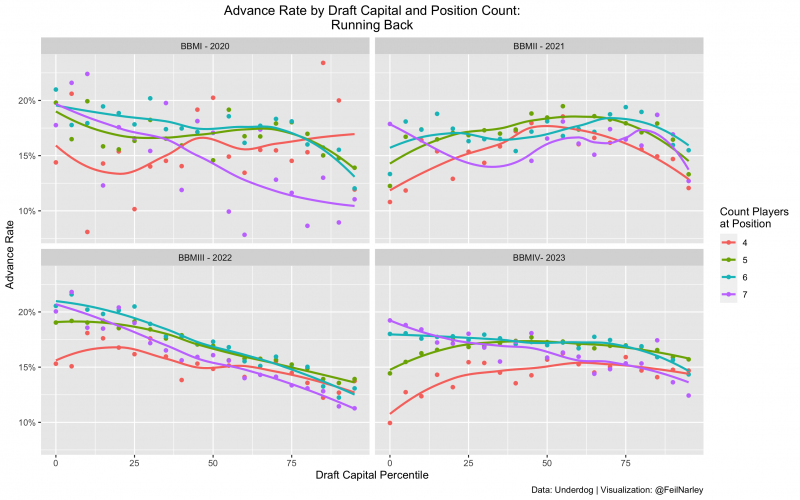
Running back advance rate by draft capital expenditure and count of running backs drafted.
The reliable importance of wide receiver points, which tend to be harder to replace late in the draft, has significantly shifted our view of all other positions. This thought process has become so commonplace that any early pick straying from wide receiver is often referred to as a “detour”.
Not falling behind the wide receiver avalanche has become a common refrain on “ship chasing”, a drafting trio well known for their wide receiver-heavy style and fans. There is certainly truth to not wanting to fall behind at wide receiver because of the difficulty of picking up those points later in the draft, but I’d think of the trade-off as similar to an issue I faced while drafting superflex teams recently.
Blindly taking quarterbacks because they are a prerequisite to performing well in the format, fails to take into account the opportunity cost and potential to build an objectively worse version of other teams. Simultaneously, eschewing the market at every turn can put you in a massive hole at quarterback. Consequently, accounting for the market dynamics and being intentional about “detours” should give the strongest results.
Running backs often project better than any player available on the board in the early to mid-rounds. Making each pick in a vacuum without accounting for what is likely to be available in the future will not serve you well. If running back value hardly decreases from round five to round nine, opting for those earlier players can paint you into a corner. The pick you deem most valuable becomes untenable as you’re already so invested in the position making another selection would hardly move the needle, while other positions yearn for attention. Make sure to understand how your current picks influence your future picks.
Approaching QB
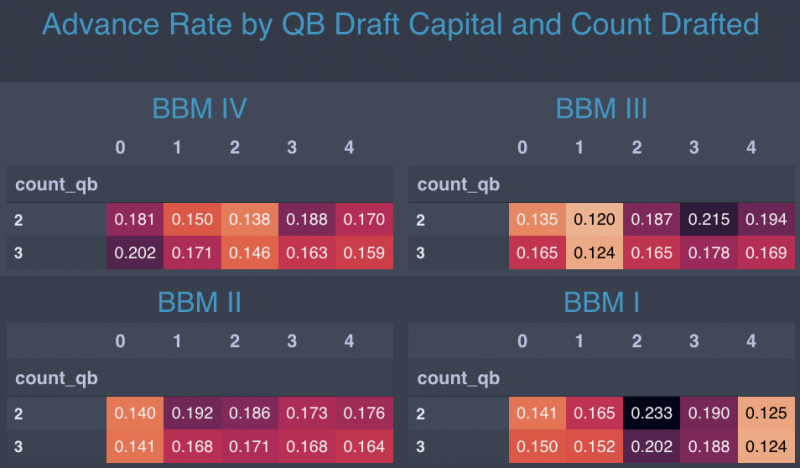
Despite quarterback commonly being listed first on team structures, I wanted to leave it to later in this article because it is inherently tied to individual player outcomes much more than wide receiver and running back. Additionally, quarterback is commonly more a function of who already resides on your roster than a proactive choice most running backs and wide receivers represent.
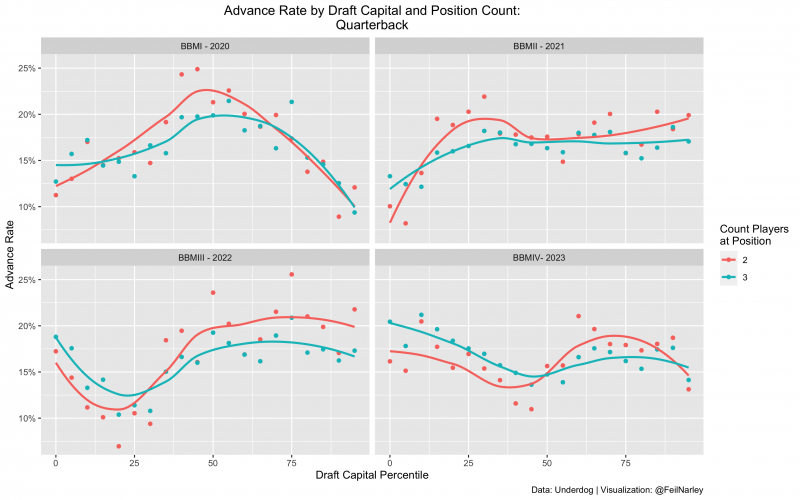
Quarterback advance rate by draft capital expenditure and count of quarterbacks drafted.
Most constructions have some merit based on historical data. While an uncommon construction, taking one quarterback frequently bubbles up as a niche roster construction debate. Historical data on these teams look surprisingly reasonable; however, applying additional logical checks, I do not believe this “trend” holds much water moving forward. Early quarterbacks should make their way into your lineup nearly every week, but early quarterbacks have been remarkably healthy over the last few years. This dives more into individual player results than roster construction research should, in my opinion. Additionally, only having one quarterback reduces the total number of possible lineups for teams negatively impacting drafters’ playoff chances.
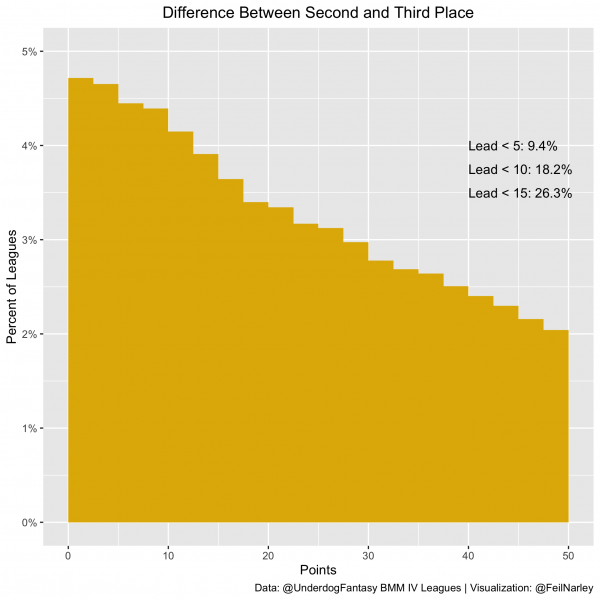
Ceeding a few points can impact your odds of advancing meaningfully.
I’ll be exploring bye structures more in an upcoming article about leveraging the schedule in tournaments.
Approaching TE
There is no silver bullet at tight end. Both high draft capital plays and back end of the draft plays can pay off. The highest-end outcomes are highly tied to how a few select players performed, similar to quarterback. Being in on elite TE in BBM III proved fruitful until the playoffs when Travis Kelce disappeared. Last year, Kelce scored seven fewer touchdowns and demonstrated significantly less consistency than in previous years. Accordingly, high-end TE teams performed much worse.
On the other side of the spectrum, the Dan Zack special has shown relatively well each of the last four years. Having four TEs does not significantly hurt your team if you spend on them appropriately, but it can limit top top-end single-week upside.
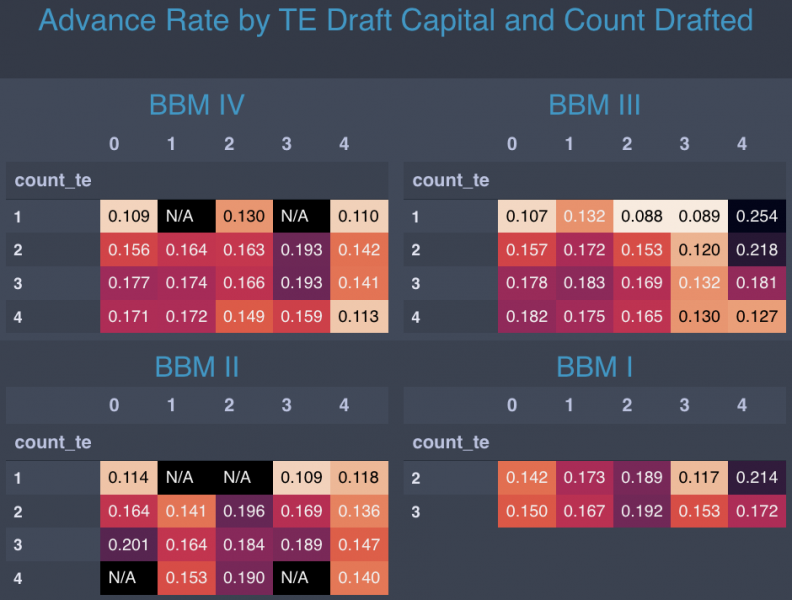
Moving to this year, the definition of elite tight end has become a very hot topic. Comparing this class of top-end talent to that of past years does not seem completely fair given the reduced cost. Taking Trey McBride at the four-five turn brings much different expectations than Travis Kelce in the first or Kyle Pitts in the second. Top-end tight ends offer the additional flexibility of only needing to take two tight ends. At these reduced costs, I’m inclined to consider three tight ends only for the majority of my builds, even with an early tight end pick. It is also worth noting that the double elite tight end teams tend to perform worse than teams selecting only one elite TE.
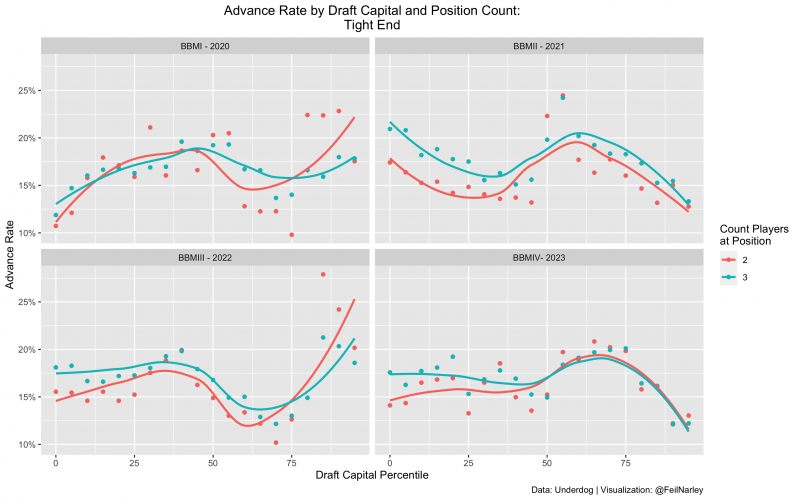
Tight end advance rate by draft capital expenditure and count of tight ends drafted.
Along with the elite tight end discussion, many have voiced opinions that the late tight ends are considerably weaker than last year. This appears true from the outset, but we have the benefit of hindsight bias. Trey McBride was not universally considered a fantastic upside pick; if he were, he likely would have gone earlier than the last two rounds of drafts. Perhaps there are fewer cases to paint with upside, but tight end has been a position where players break out considerably later and from less expected places than other positions. The bar for a successful tight end season is pretty low.
As the top couple batches of tight ends come off the board, I’m inclined to embrace the randomness and wait for the few rounds.
Rookies
In the past, rookies have been pivotal in cashing big-time prizes in tournaments. There has been a significant amount of research on how rookies beat expectations more frequently and to greater extents than players they go around. Plus, rookies often come on down the late stretch in the most important weeks of the fantasy season.
It's dangerous to forecast events five months in advance, but there is one group that dependably and intuitively performs best at the end of the year: rookies. In leagues that emphasize the last few weeks (e.g. tournaments and redraft), it's generally smart to target rookies. pic.twitter.com/ydUhu0adnI
— Jack Miller (@JackMiller02) August 2, 2021
Jack Miller and others have looked into rookie performance. The findings all align that rookies tend to come on down the stretch of the fantasy season. There has also been increased evidence that this is more prevalent in wide receivers and players without top-end capital. Marvin Harrison is likely to see near-maximum usage from day one as a dominant prospect. Players like Malik Washington or Devontez Walker will have to force their way onto the field and earn snaps, which may take months before seeing a full workload if they ever do.
This year, I’d exercise a bit more caution when drafting rookies. The market has updated significantly bringing rookies to the forefront. Previously players like Garrett Wilson went in the ninth round, but now Marvin Harrison is a fixture of the one-two turn. These elevated prices on top-end talent means they have to clear a higher bar. Perhaps the NFL believes in younger players more now than before, but expecting the ninth receiver to get drafted in the NFL draft to beat sixth-round fantasy draft expectations seems ambitious.
Ownership
As one gets deeper into best ball circles, the concept of “uniqueness” often comes up. “Uniqueness” or differentiation involves understanding what your competition is likely to look like and making decisions to separate yourself from the field in terms of team construction. This can come in the form of roster allocations, player combinations, or fielding an uncommon player.
Specifically for Best Ball Mania, player combinations can be easy to overthink. The tournament spans the length of the summer and ADP is constantly in flux. A common pairing for the first month of the tournament may be all but impossible to attain at this point. Some player combinations also make sense to play into. Last season, Dak Prescott with CeeDee Lamb was the most frequently owned duo. Despite this, anyone would have a hard time faulting you for taking the Cowboys' alpha receiver with his pocket passer quarterback.
Out of the top 100 player bigrams, combinations of two players, only six were not a player stacked with his quarterback. Of those six, three were not two teammates stacked. In addition to that, three of the top 100 diagrams were QB + RB. Almost all of the most frequently occurring stacks were pass catcher + quarterback. Given the format of the tournament pitting you up against smaller groups along the way, I would not be overly concerned about combination frequency.
Importantly players can only appear on one out of 12 teams initially. This automatically limits the upper ownership. Raheem Mostert advanced over 40% of the time last year, so he appeared on just over 20% of teams entering round two. For the best mid to late-round player, I’d accept a 20% ownership tag in a heartbeat. If this were to occur again this year, he would likely only appear on two or three of your opponents' teams in round two. Once again, this level of ownership should not frighten anyone
In each draft, there are 216 selections. This limits how frequently back-end players show up on team teams. Once the draft enters the later rounds, the difference in performance between someone at ADP and someone two rounds after ADP is minimal. Reaching and being unpredictable at this point should not hinder your performance and may help. Extreme outliers Puka Nacua and Kyren Williams were drafted ~33% and ~20% of the time. Posting advance rates north of 30%, these would normally be some of the most commonly seen players entering the second round, but taking into account how frequently they were drafted, they were not capable of rising to chalky status immediately.
Getting points from unexpected avenues, through players most of your opponents will inherently not have provides an advantage. Taking the players who are not going in every draft should provide drafters with an advantage. Looking at Hayden Winks’s research, we should also be cautious about scrolling too far down to players going almost entirely undrafted. Chances are the players going entirely undrafted have good reason to be there and may struggle to see the field at all, never mind contributing to your lineup.
Stephen Hoopes wrote about uncommonly utilized roster structures recently, so I would point anyone interested in that concept to his article to dive deeper. When looking to try out less frequently used structures, considering why it is uncommon should be your first consideration. Teams with one or four quarterbacks are likely uncommon because they concede expected points and advance rate to the field. This is not to say you cannot and should not implement these structures. I for one am almost certainly overweight on 3483 teams as I like the strength early running backs provide.
Conclusion
In culmination, there are common trends from BBM to BBM. As the market adjusts and updates taking more of these throughlines into account, staying at the peak of the game requires knowledge and perspective. Going blind off of vibes can only serve you so well, but the same can be said of marching to previous data. Applying lessons and updating approaches as the market changes will yield the best results.
For more best ball thoughts, please follow me on Twitter @FeilNarley. Any articles I write or fantasy-related endeavors I do will be posted there. In the next few days, I will also be writing about using the schedule to your advantage in best ball tournaments. This article and many more will be available here on 4for4.