Do Players Perform Better in Fantasy Football in a Contract Year?
A while back, while I was looking through 4for4’s history of incredible content, I stumbled upon this article written way back in 2012 by Jonathan Bales. It got me thinking. I love taking a look at players in a contract year, but with updated data, does the old adage about players improving play when the pressure is on for new money hold up? Bales found it to be more myth than fact a decade ago, but has the data changed? This year, I built off my data from the previous years, adding new data from 2022 to see if anything changed.
Getting Started
I looked at the last eight years of players in a contract year to determine whether or not there was a significant increase in fantasy points per game (FPPG) from the previous season.
Some qualifiers:
- Players must have played at least eight games in both years. Since I was using FPPG, I didn’t want to skew the results by including someone who was productive in a small sample size, nor did I want to include someone who missed significant time due to injury in either of the seasons (i.e. Rob Gronkowski didn't play in 2019).
- Players must’ve scored at least 5.0 FPPG in their contract year. Anything less than that was unlikely to return a player worth seriously considering in a redraft league.
- I excluded players who re-signed with their own teams early or during the season. The data comes from players who were expected to be top-100 free agents after the end of the season, and was pulled from various archived news outlets and reports. The attempt is to be more meaningful than completely comprehensive.
I started with an overall look at the numbers by year, to check for annual consistency.
| Year | Sum of Previous Year FPPG | Sum of Contract Year FPPG | Change in FPPG | Percentage Change |
|---|---|---|---|---|
| 2015 | 118.9 | 160.0 | +41.1 | +34.6% |
| 2016 | 181.5 | 188.2 | +6.7 | +3.7% |
| 2017 | 152.7 | 141.2 | -11.5 | -7.5% |
| 2018 | 95.2 | 105.1 | +9.9 | +10.4% |
| 2019 | 289.9 | 281.3 | -8.6 | -3.0% |
| 2020 | 397.6 | 464.7 | +67.1 | +16.9% |
| 2021 | 460.6 | 463.4 | +2.8 | +0.6% |
| 2022 | 407.5 | 428.2 | +20.7 | +5.1% |
| Grand Total | 2,103.9 | 2,232.1 | +128.2 | +6.1% |
The first thing that stands out is there is no consistency year-to-year. That's not a good sign for making determinations, and there’s a huge jump back in 2015 followed by a significant fall in 2017. That seems like there’s a likely outlier in each year. There is an overall increase of 6.1% over the course of the last eight years, so at least there’s a little bit of a premise for contract year improvements on a macro scale.
Let’s take a look at it by position:
| Position | Sum of Previous Year FPPG | Sum of Contract Year FPPG | Sum of Increase in FPPG | Percentage Increase |
|---|---|---|---|---|
| QB | 440.1 | 425.5 | -14.6 | -3.3% |
| RB | 778.5 | 808.1 | 29.6 | 3.8% |
| TE | 161.1 | 188.4 | 27.3 | 16.9% |
| WR | 724.2 | 810.1 | 85.9 | 11.9% |
| Grand Total | 2103.9 | 2232.1 | 128.2 | 6.1% |
It's interesting that quarterbacks are the only position that showed a drop in production in the aggregate data. Adding in the 2022 numbers made little difference, although there were some notable improvement seasons (Andy Dalton and Daniel Jones). Running backs had a down year and normalized back to 3.8% after spiking to 4.6% after the 2021 season. An overall shallow wide receiver class resulted in a modest increase from 11.5% to 11.9%. Tight end continued to normalize with a larger sample size, dropping from +78.5% in 2020 to +34.5% in 2021, to +14.9% in the eighth year of data. Still, with tight end, when looking a little deeper, very few players qualify for consideration each year. More on that later.
The data continues to show a macro increase for players in a contract year. To get an idea of how significant each category is, let’s look at the players and years broken out by position and see if we notice any trends.
Quarterbacks
Quarterbacks are so dependent on opportunity, coaching, and supporting cast, that it’s difficult to take all the different factors into consideration when evaluating whether or not being in a contract year was an actual motivator.
| Player | Year | Sum of Previous Year FPPG | Sum of Contract Year FPPG | Sum of Increase in FPPG | Percentage Increase |
|---|---|---|---|---|---|
| Ryan Fitzpatrick | 2015 | 15 | 17.8 | 2.8 | 18.7% |
| Colin Kaepernick | 2016 | 12 | 15.3 | 3.3 | 27.5% |
| Kirk Cousins | 2016 | 18.1 | 18.8 | 0.7 | 3.9% |
| Ryan Fitzpatrick | 2016 | 17.8 | 9.5 | -8.3 | -46.6% |
| Case Keenum | 2017 | 11.1 | 15.7 | 4.6 | 41.4% |
| Drew Brees | 2017 | 20.8 | 16.4 | -4.4 | -21.2% |
| Kirk Cousins | 2017 | 18.8 | 17.4 | -1.4 | -7.4% |
| Case Keenum | 2019 | 13.4 | 7.4 | -6 | -44.8% |
| Dak Prescott | 2019 | 17.6 | 21.1 | 3.5 | 19.9% |
| Drew Brees | 2019 | 20.1 | 20.4 | 0.3 | 1.5% |
| Jameis Winston | 2019 | 17.8 | 18.7 | 0.9 | 5.1% |
| Marcus Mariota | 2019 | 12.5 | 6.5 | -6 | -48.0% |
| Philip Rivers | 2019 | 17.2 | 14.7 | -2.5 | -14.5% |
| Ryan Tannehill | 2019 | 12.9 | 18.7 | 5.8 | 45.0% |
| Tom Brady | 2019 | 17.5 | 16.5 | -1 | -5.7% |
| Mitch Trubisky | 2020 | 13.4 | 15.4 | 2 | 14.9% |
| Philip Rivers | 2020 | 14.7 | 15 | 0.3 | 2.0% |
| Ben Roethlisberger | 2021 | 17.8 | 13.6 | -4.2 | -23.6% |
| Cam Newton | 2021 | 17.3 | 10.8 | -6.5 | -37.6% |
| Jacoby Brissett | 2021 | 1.9 | 6.6 | 4.7 | 247.4% |
| Teddy Bridgewater | 2021 | 16.1 | 14.5 | -1.6 | -9.9% |
| Andy Dalton | 2022 | 10.5 | 12.4 | 1.9 | 18.1% |
| Baker Mayfield | 2022 | 12.9 | 10.1 | -2.8 | -21.7% |
| Daniel Jones | 2022 | 15.2 | 18.1 | 2.9 | 19.1% |
| Jacoby Brissett | 2022 | 6.6 | 10.5 | 3.9 | 59.1% |
| Jimmy Garoppolo | 2022 | 15.2 | 15 | -0.2 | -1.3% |
| Lamar Jackson | 2022 | 20 | 19.7 | -0.3 | -1.5% |
| Taylor Heinicke | 2022 | 13.9 | 12.9 | -1 | -7.2% |
| Tom Brady | 2022 | 22 | 16 | -6 | -27.3% |
| Grand Total | 440.1 | 425.5 | -14.6 | -3.3% |
Looking at the names involved, I immediately discount players like Philip Rivers, Tom Brady, Drew Brees, and Ben Roethlisberger. These guys are/were established, consistent producers for long-term teams, and it’s unlikely that contract status has anything to do with their production levels year-to-year. There are a lot of repeat names on the list, which makes sense. Contract-year quarterbacks are often journeymen and/or players toward the end of their careers that struggle to lock up long-term money and don’t re-sign during the final year.
Case Keenum had a huge increase when he played in Denver, then a huge decrease over two years in Washington. That’s not surprising, as he fits the journeyman designation, and his increase in production was more likely a product of surprise opportunity than anything else.
Jacoby Brissett's last year is notable, although his change of scenery and opportunity makes him hard to bank on as well.
The names I’m looking at are Andy Dalton last year, Daniel Jones, Taylor Heinicke, Lamar Jackson, Mitch Trubisky, Jameis Winston, Marcus Mariota, Dak Prescott, Ryan Tannehill, and Kirk Cousins in 2016 before the repeated franchise tag put a sour taste in his mouth. The first four are all from last year, in an unusually notable contract-year class of passers. Dalton was looking to earn another bridge job - which he may have in Carolina - while Jones and Jackson were gunning for big new deals - which they received. Heinicke is interesting because he ended up with a great opportunity to earn the job long-term, but was unable to do it.
Combined, these 10 quarterbacks saw a 10.4 FPPG improvement in contract years or a 6.8% increase. We could argue over whether Tannehill should be included since he entered the season as a backup and was in an entirely new situation, but the only one of the six players who saw a decrease was Mariota in 2019, who was benched for Tannehill. Likewise, Winston went into a Bruce Arians offense for the first time in his career in 2019, which definitely contributed to his increase in production. Prescott in 2019, Trubisky in 2020, and Jones and Jackson last year are perhaps the most notable examples since they were openly gunning for new contracts.
Verdict: Some Impact. Contract year can potentially make a difference in the rare instance you find a quality starting quarterback young enough to show progress.
Potential 2023 Candidates: Jacoby Brissett, Baker Mayfield, Gardner Minshew
Running Backs
Running backs are primarily dependent on workload. In that, contract year seems less likely to be a factor for this position group. Let’s look:
| Player | Year | Sum of Previous Year FPPG | Sum of Contract Year FPPG | Sum of Increase in FPPG | Percentage Increase |
|---|---|---|---|---|---|
| Alfred Morris | 2015 | 10.7 | 5.4 | -5.3 | -49.5% |
| Bilal Powell | 2015 | 2 | 8 | 6 | 300.0% |
| Chris Ivory | 2015 | 8.4 | 11.5 | 3.1 | 36.9% |
| Chris Johnson | 2015 | 5.7 | 9.2 | 3.5 | 61.4% |
| Doug Martin | 2015 | 6.2 | 12.5 | 6.3 | 101.6% |
| Lamar Miller | 2015 | 11.6 | 11.6 | 0 | 0.0% |
| LeGarrette Blount | 2015 | 5.5 | 9.7 | 4.2 | 76.4% |
| Matt Forte | 2015 | 15 | 13 | -2 | -13.3% |
| Christine Michael | 2016 | 3.2 | 7.7 | 4.5 | 140.6% |
| DeAngelo Williams | 2016 | 12 | 9.1 | -2.9 | -24.2% |
| Latavius Murray | 2016 | 10.1 | 12.5 | 2.4 | 23.8% |
| LeGarrette Blount | 2016 | 9.7 | 14.1 | 4.4 | 45.4% |
| Doug Martin | 2017 | 8.9 | 5.9 | -3 | -33.7% |
| Frank Gore | 2017 | 11 | 9 | -2 | -18.2% |
| Isaiah Crowell | 2017 | 10.3 | 7.1 | -3.2 | -31.1% |
| Jerick McKinnon | 2017 | 6.9 | 7.8 | 0.9 | 13.0% |
| LeGarrette Blount | 2017 | 14.1 | 6.1 | -8 | -56.7% |
| LeVeon Bell | 2017 | 20 | 17.1 | -2.9 | -14.5% |
| Rex Burkhead | 2017 | 3.7 | 10 | 6.3 | 170.3% |
| Adrian Peterson | 2018 | 6.8 | 10.6 | 3.8 | 55.9% |
| Mark Ingram | 2018 | 13.8 | 10.1 | -3.7 | -26.8% |
| T.J. Yeldon | 2018 | 5.8 | 8.4 | 2.6 | 44.8% |
| Tevin Coleman | 2018 | 9.4 | 10.1 | 0.7 | 7.4% |
| Austin Ekeler | 2019 | 9.3 | 13.6 | 4.3 | 46.2% |
| Derrick Henry | 2019 | 11.6 | 18.4 | 6.8 | 58.6% |
| Frank Gore | 2019 | 6.5 | 5.1 | -1.4 | -21.5% |
| Jordan Howard | 2019 | 10 | 10.1 | 0.1 | 1.0% |
| Kareem Hunt | 2019 | 18.6 | 8.1 | -10.5 | -56.5% |
| Kenyan Drake | 2019 | 9.6 | 11.6 | 2 | 20.8% |
| Melvin Gordon | 2019 | 18.5 | 11.6 | -6.9 | -37.3% |
| Peyton Barber | 2019 | 8.1 | 6.3 | -1.8 | -22.2% |
| Aaron Jones | 2020 | 16.6 | 16.8 | 0.2 | 1.2% |
| Alvin Kamara | 2020 | 12 | 22.4 | 10.4 | 86.7% |
| Chris Carson | 2020 | 13 | 14.1 | 1.1 | 8.5% |
| Chris Thompson | 2020 | 4.7 | 4.1 | -0.6 | -12.8% |
| Dalvin Cook | 2020 | 17.1 | 22.6 | 5.5 | 32.2% |
| Derrick Henry | 2020 | 18.4 | 20.2 | 1.8 | 9.8% |
| Gus Edwards | 2020 | 5.4 | 7.7 | 2.3 | 42.6% |
| Jamaal Williams | 2020 | 7.7 | 8 | 0.3 | 3.9% |
| James Conner | 2020 | 11.2 | 11.3 | 0.1 | 0.9% |
| James White | 2020 | 8.5 | 6.6 | -1.9 | -22.4% |
| Kareem Hunt | 2020 | 8.1 | 12.5 | 4.4 | 54.3% |
| Kenyan Drake | 2020 | 11.6 | 12 | 0.4 | 3.4% |
| Leonard Fournette | 2020 | 12.2 | 8.8 | -3.4 | -27.9% |
| Malcolm Brown | 2020 | 4.1 | 6.1 | 2 | 48.8% |
| Rex Burkhead | 2020 | 5.7 | 9.5 | 3.8 | 66.7% |
| Tevin Coleman | 2020 | 8.2 | 1.3 | -6.9 | -84.1% |
| Todd Gurley | 2020 | 12.6 | 10 | -2.6 | -20.6% |
| Boston Scott | 2021 | 5.2 | 9.2 | 4 | 76.9% |
| Chase Edmonds | 2021 | 8.8 | 10.2 | 1.4 | 15.9% |
| Cordarrelle Patterson | 2021 | 3.3 | 13 | 9.7 | 293.9% |
| Darrel Williams | 2021 | 3.5 | 10.1 | 6.6 | 188.6% |
| David Johnson | 2021 | 13.6 | 5 | -8.6 | -63.2% |
| J.D. McKissic | 2021 | 9.5 | 9.7 | 0.2 | 2.1% |
| James Conner | 2021 | 11.3 | 15.9 | 4.6 | 40.7% |
| Jeff Wilson | 2021 | 12.3 | 5.3 | -7 | -56.9% |
| Jerick McKinnon | 2021 | 7.3 | 2.5 | -4.8 | -65.8% |
| Justin Jackson | 2021 | 6.2 | 5.8 | -0.4 | -6.5% |
| Kalen Ballage | 2021 | 7.2 | 0.6 | -6.6 | -91.7% |
| Latavius Murray | 2021 | 8.3 | 7 | -1.3 | -15.7% |
| Leonard Fournette | 2021 | 8.8 | 15.8 | 7 | 79.5% |
| Melvin Gordon | 2021 | 12.2 | 11.3 | -0.9 | -7.4% |
| Peyton Barber | 2021 | 3.3 | 5 | 1.7 | 51.5% |
| Phillip Lindsay | 2021 | 5.7 | 3.1 | -2.6 | -45.6% |
| Sony Michel | 2021 | 8 | 8 | 0 | 0.0% |
| Alexander Mattison | 2022 | 6.9 | 4.8 | -2.1 | -30.4% |
| Ameer Abdullah | 2022 | 4.7 | 2.8 | -1.9 | -40.4% |
| Damien Harris | 2022 | 13.4 | 7.5 | -5.9 | -44.0% |
| Darrell Henderson | 2022 | 12.4 | 6.5 | -5.9 | -47.6% |
| David Montgomery | 2022 | 13.4 | 10 | -3.4 | -25.4% |
| Devin Singletary | 2022 | 10.5 | 9.9 | -0.6 | -5.7% |
| D'Onta Foreman | 2022 | 9.9 | 7.6 | -2.3 | -23.2% |
| Jamaal Williams | 2022 | 8.2 | 12.9 | 4.7 | 57.3% |
| James Robinson | 2022 | 11.3 | 7.6 | -3.7 | -32.7% |
| Jerick McKinnon | 2022 | 2.5 | 9.9 | 7.4 | 296.0% |
| Josh Jacobs | 2022 | 13.3 | 17.8 | 4.5 | 33.8% |
| Kareem Hunt | 2022 | 12.4 | 6.4 | -6 | -48.4% |
| Kenyan Drake | 2022 | 7.3 | 8 | 0.7 | 9.6% |
| Miles Sanders | 2022 | 8.7 | 12.2 | 3.5 | 40.2% |
| Nyheim Hines | 2022 | 5.4 | 3.4 | -2 | -37.0% |
| Samaje Perine | 2022 | 4.6 | 7.7 | 3.1 | 67.4% |
| Saquon Barkley | 2022 | 9.9 | 16 | 6.1 | 61.6% |
| Tony Pollard | 2022 | 9.1 | 14.3 | 5.2 | 57.1% |
| Grand Total | 778.5 | 808.1 | 29.6 | 3.8% |
While some of these running backs definitely showed up big in contract years (Tevin Coleman, Latavius Murray, Derrick Henry, Saquon Barkley, and Josh Jacobs specifically) it’s not consistent enough across the board to attribute real substance to contract status. The overall numbers show a slight increase at the position, and there are several candidates this season, but I think we can safely say opportunity and workload are still the primary indicators to use for evaluating running backs. There are a lot of older guys on one-year deals (Adrian Peterson) and journeyman role-players (LeGarrette Blount), but there are some notable players on the list. Derrick Henry, Kenyan Drake, and Austin Ekeler all shined in contract years in 2019 and then Henry and Drake managed to maintain similar production in 2020 contract years - though Drake and Ekeler in 2019 were aided by a significant increase in workload due to external factors. Meanwhile, in 2020, we saw Aaron Jones, Chris Carson, and James Conner all see decreases. 2021 might be the best hope for contract-year success at the position, with Chase Edmonds, Boston Scott, and Leonard Fournette all increasing production on semi-similar usage. Then again with Jacobs and Barkley last year, though situation and health can also be attributed to those two, respectively. Samaje Perine saw a notable increase, but Kareem Hunt saw a huge decrease. Again, situation and opportunity seem to be the bigger factors there.
Verdict: Very Little Impact. The consistency isn't there to assume anything other than workload and opportunity are still the primary motivating factors at the position.
Potential 2023 Candidates: Saquon Barkley (Tag), Josh Jacobs (Tag), Tony Pollard (Tag), Austin Ekeler, D'Andre Swift, Jonathan Taylor, J.K. Dobbins, Antonio Gibson
Wide Receivers
From the eyeball test, I always found wide receivers to fluctuate in intensity more noticeably. You can tell when a receiver is trying hard on blocks, or when his routes get a little crisper. This position group saw an 11.9% overall increase, so I was anxious to take a deeper look at it:
| Player | Year | Sum of Previous Year FPPG | Sum of Contract Year FPPG | Sum of Increase in FPPG | Percentage Increase |
|---|---|---|---|---|---|
| Alshon Jeffery | 2015 | 11 | 11.6 | 0.6 | 5.5% |
| Anquan Boldin | 2015 | 8.5 | 7.2 | -1.3 | -15.3% |
| Jermaine Kearse | 2015 | 4.1 | 6.2 | 2.1 | 51.2% |
| Rishard Matthews | 2015 | 1.8 | 8.2 | 6.4 | 355.6% |
| Rueben Randle | 2015 | 7 | 8 | 1 | 14.3% |
| Travis Benjamin | 2015 | 3.2 | 7.7 | 4.5 | 140.6% |
| Alshon Jeffery | 2016 | 11.6 | 7.8 | -3.8 | -32.8% |
| Anquan Boldin | 2016 | 7.2 | 6.7 | -0.5 | -6.9% |
| Brandon LaFell | 2016 | 4.8 | 7.6 | 2.8 | 58.3% |
| Brandon Marshall | 2016 | 14.4 | 6.4 | -8 | -55.6% |
| DeSean Jackson | 2016 | 7.5 | 8.3 | 0.8 | 10.7% |
| Jeremy Kerley | 2016 | 1.7 | 5.2 | 3.5 | 205.9% |
| Kendall Wright | 2016 | 6.1 | 5.6 | -0.5 | -8.2% |
| Kenny Britt | 2016 | 5.4 | 8.5 | 3.1 | 57.4% |
| Kenny Stills | 2016 | 3.9 | 7.9 | 4 | 102.6% |
| Michael Floyd | 2016 | 8.1 | 5.3 | -2.8 | -34.6% |
| Pierre Garcon | 2016 | 7.1 | 7.6 | 0.5 | 7.0% |
| Robert Woods | 2016 | 5.1 | 5.2 | 0.1 | 2.0% |
| Ted Ginn | 2016 | 9.3 | 6.6 | -2.7 | -29.0% |
| Danny Amendola | 2017 | 3.9 | 5.2 | 1.3 | 33.3% |
| Jarvis Landry | 2017 | 8.5 | 9.3 | 0.8 | 9.4% |
| Sammy Watkins | 2017 | 6.9 | 7.2 | 0.3 | 4.3% |
| Adam Humphries | 2018 | 4.2 | 7 | 2.8 | 66.7% |
| DeSean Jackson | 2018 | 6.3 | 9.2 | 2.9 | 46.0% |
| Devin Funchess | 2018 | 8.3 | 5.6 | -2.7 | -32.5% |
| Donte Moncrief | 2018 | 4.3 | 5.2 | 0.9 | 20.9% |
| Golden Tate | 2018 | 8.2 | 7.1 | -1.1 | -13.4% |
| Jamison Crowder | 2018 | 6.3 | 6 | -0.3 | -4.8% |
| John Brown | 2018 | 4.9 | 6.4 | 1.5 | 30.6% |
| Randall Cobb | 2018 | 6.1 | 5.4 | -0.7 | -11.5% |
| Tyrell Williams | 2018 | 5.9 | 6.1 | 0.2 | 3.4% |
| Amari Cooper | 2019 | 9.4 | 10.5 | 1.1 | 11.7% |
| Breshad Perriman | 2019 | 4.6 | 7.3 | 2.7 | 58.7% |
| Danny Amendola | 2019 | 4.6 | 5.2 | 0.6 | 13.0% |
| Emmanuel Sanders | 2019 | 10.6 | 7.2 | -3.4 | -32.1% |
| Larry Fitzgerald | 2019 | 7.2 | 6.4 | -0.8 | -11.1% |
| Nelson Agholor | 2019 | 6.3 | 5 | -1.3 | -20.6% |
| Phillip Dorsett | 2019 | 3.1 | 5.1 | 2 | 64.5% |
| Robby Anderson | 2019 | 7.6 | 6.9 | -0.7 | -9.2% |
| Sammy Watkins | 2019 | 7.5 | 6.2 | -1.3 | -17.3% |
| Taylor Gabriel | 2019 | 5.3 | 6.8 | 1.5 | 28.3% |
| Zach Pascal | 2019 | 2.5 | 5.9 | 3.4 | 136.0% |
| Allen Lazard | 2020 | 4.2 | 8.1 | 3.9 | 92.9% |
| Allen Robinson | 2020 | 9.8 | 13.2 | 3.4 | 34.7% |
| Breshad Perriman | 2020 | 7.3 | 7 | -0.3 | -4.1% |
| Chris Conley | 2020 | 6.7 | 5.1 | -1.6 | -23.9% |
| Chris Godwin | 2020 | 13.4 | 13.2 | -0.2 | -1.5% |
| Cooper Kupp | 2020 | 11 | 10.8 | -0.2 | -1.8% |
| Corey Davis | 2020 | 4.8 | 11.4 | 6.6 | 137.5% |
| Curtis Samuel | 2020 | 7.4 | 11.6 | 4.2 | 56.8% |
| Danny Amendola | 2020 | 5.2 | 6 | 0.8 | 15.4% |
| Demarcus Robinson | 2020 | 4.3 | 5.3 | 1 | 23.3% |
| JuJu Smith-Schuster | 2020 | 5.9 | 11.6 | 5.7 | 96.6% |
| Keelan Cole | 2020 | 3.4 | 7.6 | 4.2 | 123.5% |
| Keenan Allen | 2020 | 9.8 | 13.9 | 4.1 | 41.8% |
| Kendrick Bourne | 2020 | 4.2 | 7 | 2.8 | 66.7% |
| Kenny Stills | 2020 | 6.2 | 2.6 | -3.6 | -58.1% |
| Larry Fitzgerald | 2020 | 6.4 | 5.7 | -0.7 | -10.9% |
| Marvin Jones | 2020 | 10.1 | 11.9 | 1.8 | 17.8% |
| Nelson Agholor | 2020 | 5 | 10.1 | 5.1 | 102.0% |
| Sammy Watkins | 2020 | 6.2 | 6.9 | 0.7 | 11.3% |
| T.Y. Hilton | 2020 | 8 | 9.1 | 1.1 | 13.8% |
| Will Fuller | 2020 | 7.7 | 14.8 | 7.1 | 92.2% |
| Willie Snead | 2020 | 4 | 6 | 2 | 50.0% |
| Zach Pascal | 2020 | 5.9 | 7.2 | 1.3 | 22.0% |
| A.J. Green | 2021 | 5.5 | 8.1 | 2.6 | 47.3% |
| Adam Thielen | 2021 | 14.5 | 12.8 | -1.7 | -11.7% |
| Allen Lazard | 2021 | 8.1 | 8.2 | 0.1 | 1.2% |
| Allen Robinson | 2021 | 13.2 | 5.7 | -7.5 | -56.8% |
| Braxton Berrios | 2021 | 4.9 | 5.8 | 0.9 | 18.4% |
| Byron Pringle | 2021 | 2.4 | 6.2 | 3.8 | 158.3% |
| Cedrick Wilson | 2021 | 2.7 | 7.8 | 5.1 | 188.9% |
| Chris Conley | 2021 | 5.1 | 3.4 | -1.7 | -33.3% |
| Chris Godwin | 2021 | 13.2 | 13.8 | 0.6 | 4.5% |
| Christian Kirk | 2021 | 8.7 | 9.9 | 1.2 | 13.8% |
| Danny Amendola | 2021 | 6 | 7.1 | 1.1 | 18.3% |
| Davante Adams | 2021 | 21.5 | 17.7 | -3.8 | -17.7% |
| Emmanuel Sanders | 2021 | 9.6 | 7.9 | -1.7 | -17.7% |
| Isaiah McKenzie | 2021 | 4.9 | 2.8 | -2.1 | -42.9% |
| Jakobi Meyers | 2021 | 8.1 | 8.5 | 0.4 | 4.9% |
| Jalen Guyton | 2021 | 5.2 | 5.1 | -0.1 | -1.9% |
| Jamison Crowder | 2021 | 11.9 | 7 | -4.9 | -41.2% |
| Josh Reynolds | 2021 | 6.1 | 5.5 | -0.6 | -9.8% |
| Kalif Raymond | 2021 | 1.5 | 6.8 | 5.3 | 353.3% |
| Mack Hollins | 2021 | 1.9 | 3.1 | 1.2 | 63.2% |
| Marquez Valdes-Scantling | 2021 | 7.6 | 6.7 | -0.9 | -11.8% |
| Michael Gallup | 2021 | 9 | 8.2 | -0.8 | -8.9% |
| Mike Williams | 2021 | 8.6 | 13 | 4.4 | 51.2% |
| Nick Westbrook-Ikhine | 2021 | 0.6 | 5.5 | 4.9 | 816.7% |
| Randall Cobb | 2021 | 8.1 | 6.6 | -1.5 | -18.5% |
| Russell Gage | 2021 | 9.1 | 9.3 | 0.2 | 2.2% |
| T.Y. Hilton | 2021 | 9.1 | 6.3 | -2.8 | -30.8% |
| Tre'Quan Smith | 2021 | 6.2 | 6.5 | 0.3 | 4.8% |
| Zay Jones | 2021 | 1.8 | 4.8 | 3 | 166.7% |
| Allen Lazard | 2022 | 8.2 | 9.7 | 1.5 | 18.3% |
| Chris Conley | 2022 | 3.4 | 0.4 | -3 | -88.2% |
| Darius Slayton | 2022 | 4.3 | 6.6 | 2.3 | 53.5% |
| DeAndre Carter | 2022 | 4 | 5.3 | 1.3 | 32.5% |
| Isaiah McKenzie | 2022 | 2.8 | 6.6 | 3.8 | 135.7% |
| Jakobi Meyers | 2022 | 8.5 | 10.5 | 2 | 23.5% |
| Keelan Cole | 2022 | 4.3 | 1.8 | -2.5 | -58.1% |
| Mack Hollins | 2022 | 3.1 | 7.4 | 4.3 | 138.7% |
| Marquez Callaway | 2022 | 7.6 | 2.1 | -5.5 | -72.4% |
| Marvin Jones | 2022 | 8.5 | 5.9 | -2.6 | -30.6% |
| Mecole Hardman | 2022 | 13.2 | 20.4 | 7.2 | 54.5% |
| Nick Westbrook-Ikhine | 2022 | 5.5 | 4.1 | -1.4 | -25.5% |
| Noah Brown | 2022 | 2 | 5.8 | 3.8 | 190.0% |
| Olamide Zaccheaus | 2022 | 4.4 | 5.3 | 0.9 | 20.5% |
| Scott Miller | 2022 | 2.1 | 2.2 | 0.1 | 4.8% |
| Grand Total | 724.2 | 810.1 | 85.9 | 11.9% |
Throughout the list, once again, there are many older players playing on short-term deals such as Anquan Boldin, Larry Fitzgerald, Brandon Marshall, and A.J. Green. There are also some notable negatives, with Robby Anderson in 2019 the most glaring, as well as Michael Floyd in 2016. Some notable increases I largely attribute to surprise opportunities include Breshad Perriman and Zach Pascal in 2019, as well as Travis Benjamin and Rishard Matthews in 2015. You could also add last year's Isaiah McKenzie, Mack Hollins, and DeAndre Carter to the increased opportunity list.
The names that pop out as meaningful to me: Alshon Jeffery (2015); Kenny Britt (2016); Jarvis Landry (2017); Adam Humphries, Devin Funchess, Jamison Crowder, and John Brown (2018); Amari Cooper and Nelson Agholor (2019), Corey Davis, Allen Robinson, Chris Godwin, Marvin Jones, and Curtis Samuel (2020); Adam Thielen, Davante Adams, Marquez Valdes-Scantling, Michael Gallup, and Mike Williams (2021); Allen Lazard, Darius Slayton, Jakobi Meyers (2022).
Crowder, Funchess, Godwin, Agholor, Thielen, Adams, Valdes-Scantling, and Gallup had decreases in production, but the rest of that group increased. Each member of this group fits the criteria of what I would call "meaningful contract status," where a player's contract status is likely to be the most dominating factor in any change in production. I consider this when the WR:
- Has a fairly safe position on the depth chart
- Has no noticeable offensive decline around him (i.e. injury to star quarterback, etc.)
- Is not disgruntled for an easily discernible reason
It’s not perfect. Funchess, for example, suffered from a decline in Cam Newton’s health and Agholor actually got more of an opportunity in 2019 than expected due to injuries. But overall, it’s a good way to whittle the list down to find something meaningful.
Corey Davis in 2020 is a shining example of a contract-year boon. He was labeled a bust before an 87.5% increase in FPPG in 2020 and then signed a fat new contract in New York. Likewise, Mike Williams showed up last year with a 51.2% increase in FPPG, prompting the Chargers to re-sign him to a long-term deal.
My notable players' group listed above saw an overall combined increase of 12.7% in FPPG from the previous year to their contract seasons. That’s fairly significant and is worth thinking about when evaluating the players with deals expiring after this season.
Verdict: Conditional Impact. Contract-year receivers who fit my three qualifiers have shown an overall increase in production. This is significant enough to warrant consideration as a factor, but still probably not enough to be a prime motivator for drafting them.
Potential 2023 Candidates: Calvin Ridley, Corey Davis, Mack Hollins, Marquise Brown, DeVante Parker, Tyler Boyd, Tee Higgins, Michael Pittman Jr., Chase Claypool, Van Jefferson, Darnell Mooney, Donovan Peoples-Jones
Tight Ends
My theory about wide receivers would also be the case for tight ends. They can block with more intensity, work harder to come back to the quarterback and run crisper routes with extra motivation. Here are the results:
| Player | Year | Sum of Previous Year FPPG | Sum of Contract Year FPPG | Sum of Increase in FPPG | Percentage Increase |
|---|---|---|---|---|---|
| Ben Watson | 2015 | 1.6 | 7.3 | 5.7 | 356.3% |
| Ladarius Green | 2015 | 1.6 | 5.1 | 3.5 | 218.8% |
| Jack Doyle | 2016 | 0.8 | 5.4 | 4.6 | 575.0% |
| Martellus Bennett | 2016 | 5.6 | 7.1 | 1.5 | 26.8% |
| Jimmy Graham | 2017 | 7.8 | 7 | -0.8 | -10.3% |
| Jared Cook | 2018 | 4.9 | 7.9 | 3 | 61.2% |
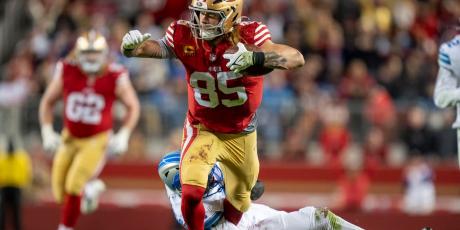
| George Kittle | 2020 | 9.8 | 12.6 | 2.8 | 28.6% |
| Gerald Everett | 2020 | 4.1 | 4.5 | 0.4 | 9.8% |
| Hunter Henry | 2020 | 7.9 | 8.2 | 0.3 | 3.8% |
| Jared Cook | 2020 | 8.9 | 7.3 | -1.6 | -18.0% |
| Jason Witten | 2020 | 4.8 | 1.6 | -3.2 | -66.7% |
| Anthony Firkser | 2021 | 4 | 4.1 | 0.1 | 2.5% |
| David Njoku | 2021 | 3.3 | 5.6 | 2.3 | 69.7% |
| Evan Engram | 2021 | 6.8 | 5.3 | -1.5 | -22.1% |
| Jared Cook | 2021 | 7.3 | 6.8 | -0.5 | -6.8% |
| Mike Gesicki | 2021 | 8.9 | 7.6 | -1.3 | -14.6% |
| MyCole Pruitt | 2021 | 1.8 | 2.6 | 0.8 | 44.4% |
| Rob Gronkowski | 2021 | 7.9 | 12 | 4.1 | 51.9% |
| Robert Tonyan | 2021 | 9.4 | 5.2 | -4.2 | -44.7% |
| Will Dissly | 2021 | 3.1 | 2.6 | -0.5 | -16.1% |
| Zach Ertz | 2021 | 5.4 | 8.5 | 3.1 | 57.4% |
| Austin Hooper | 2022 | 4.6 | 4.5 | -0.1 | -2.2% |
| Dalton Schultz | 2022 | 10 | 7.6 | -2.4 | -24.0% |
| Evan Engram | 2022 | 5.3 | 8.3 | 3 | 56.6% |
| Hayden Hurst | 2022 | 3.9 | 6.1 | 2.2 | 56.4% |
| Ian Thomas | 2022 | 1.6 | 1.8 | 0.2 | 12.5% |
| Jordan Akins | 2022 | 2.3 | 6.5 | 4.2 | 182.6% |
| Juwan Johnson | 2022 | 3.3 | 7.1 | 3.8 | 115.2% |
| Mike Gesicki | 2022 | 7.6 | 4.8 | -2.8 | -36.8% |
| O.J. Howard | 2022 | 1.6 | 2.4 | 0.8 | 50.0% |
| Robert Tonyan | 2022 | 5.2 | 5 | -0.2 | -3.8% |
| Grand Total | 170.4 | 195.8 | 25.4 | 14.9% |
There’s not enough data to come up with something conclusive here, but seeing Jared Cook (until 2021) and Martellus Bennett increase production on short-term deals might be significant. You could say the same thing for Zach Ertz in 2021, but a mid-season trade was likely the biggest factor in his increased production.
Juwan Johnson is perhaps the most notable example from last year, though he also saw increased opportunity. We also had an odd year where Dalton Schultz and Mike Gesicki took major dives in their production. Injuries at quarterback in Dallas and an entirely new offensive system and coaching staff in Miami likely played larger roles in their demise, however.
It’s a small sample size for tight ends who meet the games played and FPPG minimum requirements over the past eight years. That being said, it's a significant increase, despite some duds last year, largely aided by increased opportunities from guys like Ladarius Green and Ben Watson in 2015 and Jack Doyle the following year. The last three years have helped normalize it a little with more significant additions in 2020 (Hunter Henry, George Kittle), in 2021 (Mike Gesicki, David Njoku, Evan Engram), and in 2022 (Hayden Hurst, Johnson).
Gerald Everett, Gesicki, Njoku, and Engram were at the end of rookie deals. The most notable data point is probably Jonnu Smith in 2020, who jumped in production before signing a big deal in New England. We'll see if Mike Gesicki can launch a big swing on a one-year prove-it deal with the Patriots this year.
Verdict: Possible Impact? Contract-year tight ends could see an increase in production, but fantasy managers shouldn’t put a ton of stock into it, and opportunity still seems to be the primary factor. Next year, the sample size should continue to normalize with more marquee players set to hit free agency in 2024.
Potential 2023 Candidates: Hunter Henry, T.J. Hockenson, Evan Engram (Tag), Mike Gesicki, Cole Kmet, Noah Fant
Bottom Line
While I walked into this exercise wanting to disagree with Bales’ assessment from way back in 2012, I couldn’t completely disagree with him. Though there is some increase in production from contract-year players in this sample, the variables are far too significant to say contract status is the leading factor.
- Situation and opportunity still reign as the best categories to consider for improved fantasy production, particularly for running backs.
- Quarterbacks are rarely in a situation where contract status is the most significant determining factor.
- Wide receivers seem to be the most likely to see a bump in a contract year, assuming all other factors remain reasonably constant.
- Tight ends have a small sample size to work with, but there’s something to be said for a tight end on the last season of a rookie deal, or set to start on a one-year prove-it deal.
- In general, fantasy managers should view contract status as a tiebreaker or just one small part of the rankings puzzle, and not as a major factor.
Potential 2023 Candidates from OverTheCap.


